Accurately estimating the quality of Wikipedia articles is important task for both researchers and Wikipedia community members. In a forthcoming paper in the Proceedings of the OpenSym 2021, I describe a new method for estimating article quality in Wikipedia in one dimension that builds on the widely used ORES quality model and that improves on the techniques researches have used to incorporate measures of quality into their studies of Wikipedia in the past. I will presenting virtually this week at the OpenSym 2021 conference. OpenSym is free and open to the public this year but requires registration.
Numerous efforts have gone into measuring the quality of Wikipedia articles and the Wikimedia Foundation maintains a machine learning model for measuring article quality on English Wikipedia called the ORES quality model. This model is trained on quality assessments conducted by members of WikiProjects that label articles into hierarchy of quality levels (i.e., stub, start-class, C-class, B-class, Good, Featured) and use boosted decision trees to predict the quality of versions of articles. This model is useful because it can predict the quality of versions of articles that haven’t been assessed. My OpenSym paper (teaser video, full presentation) builds on the ORES quality models to improve measuring Wikipedia article quality in one continuous dimension using ordinal regression models. A 1-D real-valued measure of quality is more granular and easier to use in downstream research. My method also increases the accuracy of quality prediction for units of analysis that are most important for research like articles or revisions and also estimates spacing between different levels of article quality.
An important limitation of the ORES quality models is that they do not output a single real-valued quality score. Instead, they output a multinomial distribution of the probability of an article’s quality class. This means that instead of saying “article X has quality 0.3” the model tells you “the probability of article X’s quality class is 0.1 for stub, 0.2 for start-class, 0.5 for C-class, 0.15 for B-class, 0.05 for Good and 0 for featured and the most probable quality class (MPQC) is C.” Using this kind of output in a downstream statistical analysis is kind of messy. For example, it might seem reasonable to use the MPQC as an integer-valued measure of quality, but this throws away information. Suppose ORES says that “the probability of article Y’s quality class is 0.00 for stub, 0.15 for start-class, 0.5 for C-class, 0.2 for B-class, 0.1 for Good, and 0.05 for Featured” According to the ORES quality model, Y probably has greater quality than X. Even though both have a MPQC of C-class, there’s a much greater change for article Y to be B-class or better than for article X. Is there a way to use the ORES probabilities to build a more granular measure of quality that accounts for this difference?
Aaron Halfaker, one of the creators of the ORES system, combined the probabilities into a 1-D score for one of his research projects by taking a weighed sum of the probabilities and assuming that Wikipedia article quality levels are “evenly spaced.” This creates a score out of the quality class probabilities by multiplying each probability by a weight so that probabilities for higher quality levels get more weight. He chose the weights [0,1,2,3,4,5] so an article gets 0 quality points for being a probable stub, 1 for the probability of being start-class, 2 for C-class, and so on with 5 points for Featured. This results in a nice continuous measure of quality that simplifies downstream statistical analysis. A number of others have followed his lead.
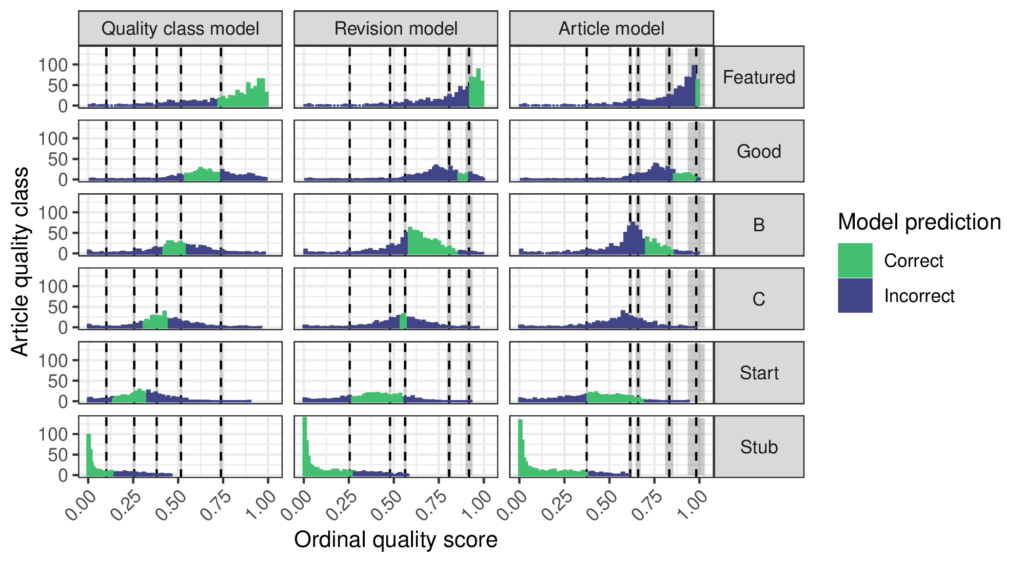
But how reasonable is the “evenly spaced” assumption that supports using the weights [0,1,2,3,4,5]? Could there be a way to pick weights to combine the ORES probabilities without using this assumption? My paper explains why ordinal regression is the right tool for the job and proposes a procedure for fitting an ordinal regression model to a sample representative of a unit of analysis like articles or revisions or quality classes that have been labeled by a WikiProject and scored by the ORES quality model. The ordinal regression predicts the quality labels as a function of the ORES scores and in this way finds a good way to combine the ORES scores into a single value. It also infers threshold parameters that define different regions of the quality score corresponding to quality classes and this allows the “evenly spaced” assumption to be tested. The figure above shows that the article quality levels are not evenly spaced! Interestingly, the way that they are unevenly spaced depends on how quality is measured. If the quality scale is designed to be accurate across all quality classes, then the quality levels are relatively even. However, if it is designed to be accurate for revisions or articles then more of the scale goes to lower levels of quality. Overall, the models agree that the difference between C-class and Start articles is smaller than that between the other levels.
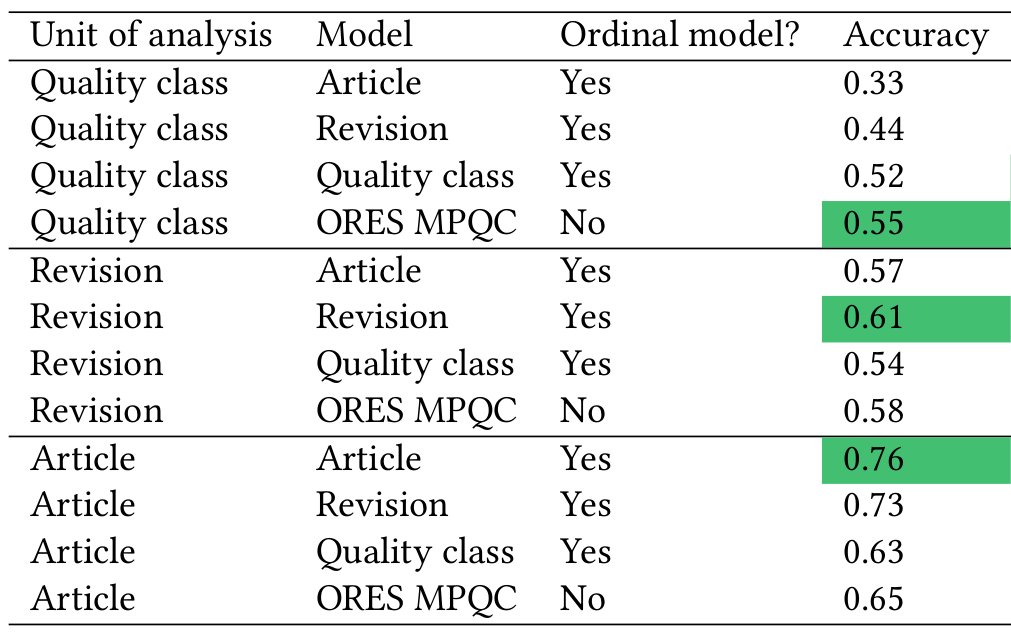
Using the quality scores based on ordinal regression also improves accuracy. This mostly comes from calibrating the ordinal model to the appropriate unit of analysis. The ORES quality model is fit on a “balanced” dataset where each quality class is equally represented. This means that the ORES quality model has learned that each quality class is equally likely to occur in the data. Of course, in reality lower quality articles are far more common than high quality articles. There are over 3,000,000 Stubs on English Wikipedia but less than 8,000 Featured articles. As the table below shows, fitting ordinal models that know the true proportion of each quality class in a sample can improve accuracy compared to the ORES quality model.
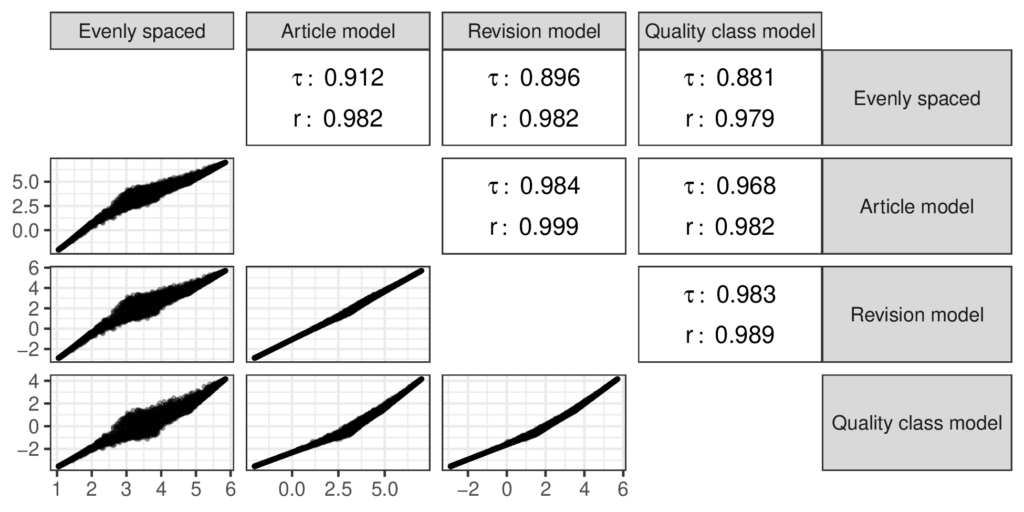
Even though my study has found evidence against the “evenly spaced” assumption, I also found that the quality scores based on it are strongly correlated with the scores from the ordinal model as shown in the figure below. The ‘𝜏’ symbols in the figure stand for the Kendall rank correlation coefficient while the ‘r’ symbols stand for the Pearson correlation coefficient. I used the Kendall correlation because it can capture nonlinear divergences between the measures and the Pearson coefficient is the familiar linear correlation. The “evenly spaced” scores aren’t totally in agreement with the scores from the ordinal models, but they are close enough that I doubt that prior research that used the “evenly spaced” scores to measure quality was mislead by this choice.
Conclusions
Measuring article quality in one continuous dimension is a valuable tool for studying the peer production of information goods because it provides granularity and is amenable to statistical analysis. Prior approaches extended ORES article quality prediction into a continuous measure under the “evenly spaced” assumption. I used ordinal regression models to transform the ORES predictions into a continuous measure of quality that is interpretable as a probability distribution over article quality levels, provides an account of its own uncertainty and does not assume that quality levels are “evenly spaced.” Calibrating the models to the chosen unit of analysis improves accuracy for research applications. I recommend that future work adopt this approach when article quality is an independent variable in a statistical analysis.
My paper also has a number of other tidbits about the uncertainty of different quality measures, the importance of feedback between measurement and knowledge in the scientific process and demonstrates model calibration.
A preprint of the paper is available here. The paper has been accepted to OpenSym 2021 and will be presented at the virtual conference on September 17th. A video of the presentation is available here. A dataverse repository containing code and data from the project is available here.