Women in Data Science Puget Sound is part of a 50+-country conference series founded and organized in cooperation with Stanford University’s Data Science coalition. Anyone may attend, regardless of gender: events feature a speaker lineup composed of women in data science. The Puget Sound event is Tuesday, April 25 at the Expedia HQ in Seattle, and numerous affiliated regional and online events are scheduled in the coming weeks.
If you’re in the Seattle area, you might like to catch CDSC member Kaylea presenting a workshop! Here’s the pitch for attending her beginner-friendly session:
Let’s Re-think Political Bias & Build Our Own Classifier
How can we think about political bias without falling into assumptions about who's on what side and what that means?
Data science and ML offer us an alternative: we can parse political speech about a topic and use NLP/ML techniques to classify articles we scrape from the web.
In this hands-on workshop, we'll parse the Congressional Record, build a classifier, scrape search results, and analyze texts. You'll walk away with your own example of how to use data science to analyze political framing.
The full lineup of speakers for the Puget Sound conference is posted here. Tickets for the single-day event are $80 (see this link to request a discount code for half off).
Topics on the schedule for this event look juicy if quant work is your jam: AI, BERT, hypergraphs, visualization, forecasting, quantum computing, causal inference, survival analysis, writing better code and career management, with examples ranging from search, sales, and supply chain to economic disparity, DNA sequencing and saving wildlife!
Many online platforms are adopting machine learning as a tool to maintain order and high quality information in the face of massive influxes of of user generated content. Of course, machine learning algorithms can be inaccurate, biased or unfair. How do signals from machine learning predictions shape the fairness of online content moderation? How can we measure an algorithmic flagging system’s effects?
In our paper published at CSCW 2021, I (Nate TeBlunthuis) together with Benjamin Mako Hill and Aaron Halfaker analyzed the RCFilters system: an add-on to Wikipedia that highlights and filters edits that a machine learning algorithm called ORES identifies as likely to be damaging to Wikipedia. This system has been deployed on large Wikipedia language editions and is similar to other algorithmic flagging systems that are becoming increasingly widespread. Our work measures the causal effect of being flagged in the RCFilters user interface.
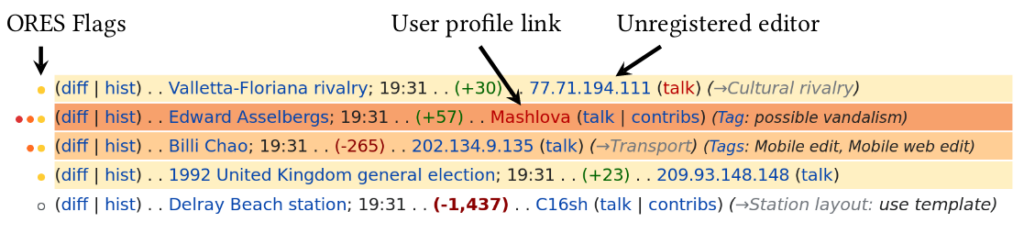
Screenshot of Wikipedia edit metadata on Special:RecentChanges with RCFilters enabled. Highlighted edits with a colored circle to the left side of other metadata are flagged by ORES. Different circle and highlight colors (white, yellow, orange, and red in the figure) correspond to different levels of confidence that the edit is damaging. RCFilters does not specifically flag edits by new accounts or unregistered editors, but does support filtering changes by editor types.
Our work takes advantage of the fact that RCFilters, like many algorithmic flagging systems, create discontinuities in the relationship between the probability that a moderator should take action and whether a moderator actually does. This happens because the output of machine learning systems like ORES is typically a continuous score (in RCFilters, an estimated probability that a Wikipedia edit is damaging), while the flags (in RCFilters, the yellow, orange, or red highlights) are either on or off and are triggered when the score crosses some arbitrary threshold. As a result, edits slightly above the threshold are both more visible to moderators and appear more likely to be damaging than edits slightly below. Even though edits on either side of the threshold have virtually the same likelihood of truly being damaging, the flagged edits are substantially more likely to be reverted. This fact lets us use a method called regression discontinuity to make causal estimates of the effect of being flagged in RCFilters.
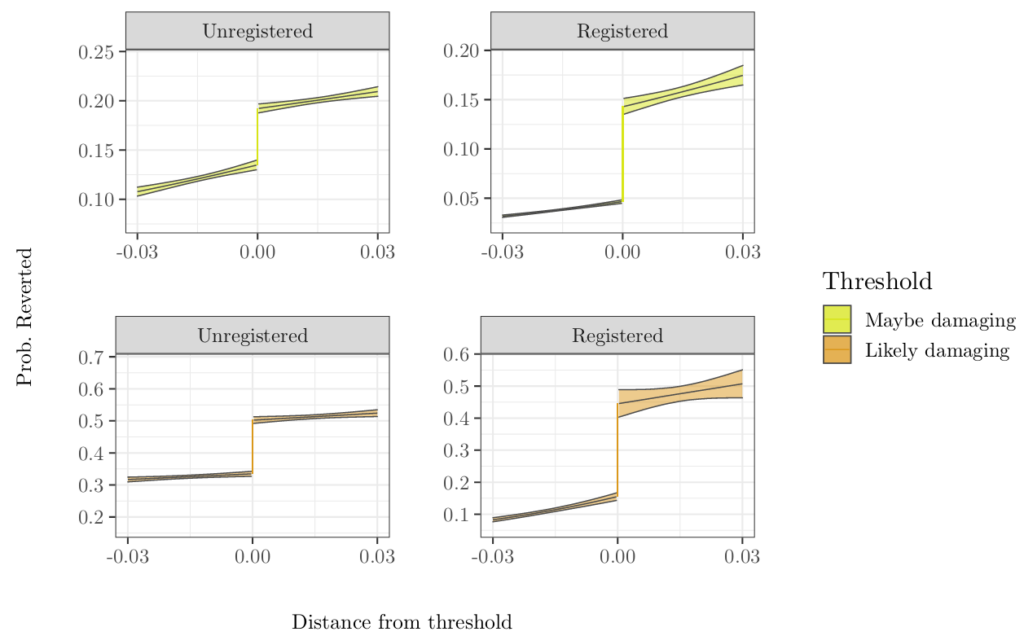
Charts showing the probability that an edit will be reverted as function of ORES scores in the neighborhood of the discontinuous threshold that triggers the RCfilters flag. The jump in the increase in reversion chances is larger for registered editors compared to unregistered editors at both thresholds.
To understand how this system may effect the fairness of Wikipedia moderation, we estimate the effects of flagging on edits on different groups of editors. Comparing the magnitude of these estimates lets us measure how flagging is associated with several different definitions of fairness. Surprisingly, we found evidence that these flags improved fairness for categories of editors that have been widely perceived as troublesome—particularly unregistered (anonymous) editors. This occurred because flagging has a much stronger effect on edits by the registered than on edits by the unregistered.
We believe that our results are driven by the fact algorithmic flags are especially helpful for finding damage that can’t be easily detected otherwise. Wikipedia moderators can see the editor’s registration status in the recent changes, watchlists, and edit history. Because unregistered editors are often troublesome, Wikipedia moderators’ attention is often focused on their contributions, with or without algorithmic flags. Algorithmic flags make damage by registered editors (in addition to unregistered editors) much more detectable to moderators and so help moderators focus on damage overall, not just damage by suspicious editors. As a result, the algorithmic flagging system decreases the bias that moderators have against unregistered editors.
This finding is particularly surprising because the ORES algorithm we analyzed was itself demonstrably biased againstunregistered editors (i.e., the algorithm tended to greatly overestimate the probability that edits by these editors were damaging). Despite the fact that the algorithms were biased, their introduction could still lead to less biased outcomes overall.
Our work shows that although it is important to design predictive algorithms to not have such biases, it is equally important to study fairness at the level of the broader sociotechnical system. Since we first published a preprint of our paper, a followup piece by Leijie Wang and Haiyi Zhu replicated much of our work and showed that differences between different Wikipedia communities may be another important factor driving the effect of the system. Overall, this work suggests that social signals and social context can interact with algorithmic signals and together these can influence behavior in important and unexpected ways.
The full citation for the paper is: TeBlunthuis, Nathan, Benjamin Mako Hill, and Aaron Halfaker. 2021. “Effects of Algorithmic Flagging on Fairness: Quasi-Experimental Evidence from Wikipedia.” Proceedings of the ACM on Human-Computer Interaction 5 (CSCW): 56:1-56:27. https://doi.org/10.1145/3449130.
We have also released replication materials for the paper, including all the data and code used to conduct the analysis and compile the paper itself.
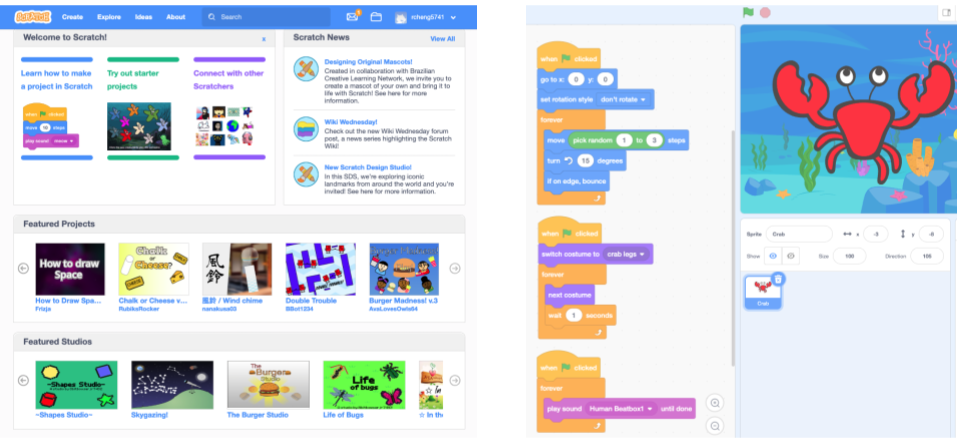
Thousands of widely used online communities are designed to promote learning. Although some rely on formal educational approaches like lesson plans, curriculum, and tests, many of the most successful learning communities online are structured as what scholars call a community of practice (CoP). In CoPs, members mentor and apprentice with each other (both formally and informally) while working toward a common interest or goal. For example, the Scratch online community is a CoP where millions of young people share and collaborate on programming projects.
Despite an enormous amount of attention paid to online CoPs, there is still a lot of disagreement about the best ways to promote learning in them. One source of disagreement stems from the fact that participants in CoPs are learning a number of different kinds of things and designers are often trying to support many types of learning at once. In a new paper that I’ve published—and that I will be presenting at CSCW this week—I conduct quantitative analyses on data from Scratch to show that there is a complex set of learning pathways at play in CoPs like Scratch. Types of participation that are associated with some important kinds of learning are often unrelated to, or even negatively associated with, other important types of learning outcomes.
The Scratch online community (left) and an example of a programming project in Scratch (right).
So what exactly are people learning in CoPs? We dug into the CoP literature and identified three major types of learning outcomes:
Learning about the domain, which refers to learning knowledge and skills for the core tasks necessary for achieving the explicit goal in the community. In Scratch, this is learning to code.
Learning about the community, which means the development of identity as a community member, forming relationships, affinities, and a sense of belonging. In Scratch, this involves learning to interact with others users and developing an identity as a community member.
Learning about the practice, which means adopting community specific values, such as the style of contribution that will be accepted and appreciated by its members. In Scratch, this means becoming a valued and respected contributor to the community.
So what types of participation might contribute to learning in a CoP? We identified several different types of newcomers’ participation that may support learning:
Contribution to core tasks which involves direct work towards the community’s explicit goal. In Scratch, this often involves making original programming projects.
Engagement with practice proxies which involves observing and participating in others’ work practices. In Scratch, this might mean remixing others’ projects by making changes and building on existing code.
Feedback exchange with community members about their contributions. In Scratch, this often involves writing comments on others’ projects.
Social bonding with community members. In Scratch, this can involve “friending” others, which allows a user to follow others’ projects and updates.
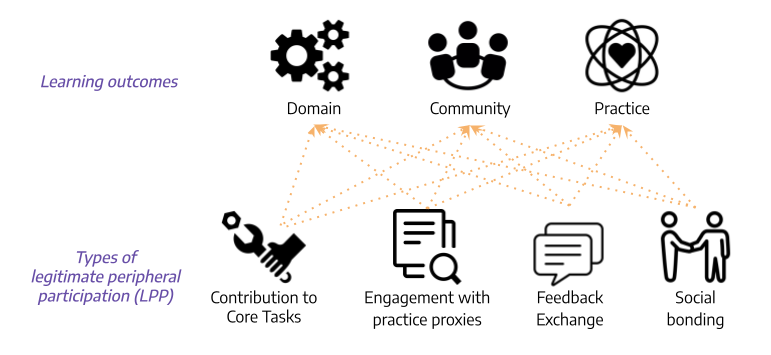
A visual representation of our study design.
We conducted a quantitative analysis on how the different types of newcomer participation contribute to the different learning outcomes. In other words, we tested for the presence/absence and the direction of the relationships (shown as the orange arrows) between each of the learning outcomes on the top of the figure and each of the types of newcomer participation on the bottom. To conduct these tests, we used data from Scratch to construct a user level dataset with proxy measures for each type of learning and type of newcomer participation as well as a series of important control variables. All the technical details about the measures and models are in the paper.
Overall, what we found was a series of complex trade-offs that suggest the kinds of things that support one type of learning frequently do not support others. For example, we found that contribution to core tasks as a newcomer is positively associated with learning about the domain in the long term, but negatively associated with learning about the community and its practices. We found that engagement with practice proxies as a newcomer is negatively associated with long-term learning about the domain and the community. Engaging in feedback exchange and social bonding as a newcomer, on the other hand, are positively associated with learning about the community and its practice.
Our findings indicate that there are no easy solutions: different types of newcomer participation provide varying support for different learning outcomes. What is productive for some types of learning outcomes can be unhelpful for others, and vice versa. For example, although social features like feedback mechanisms and systems for creating social bonds may not be a primary focus of many learning systems, they could be implemented to help users develop a sense of belonging in the community and learn about community specific values. At the same time, while contributing to core tasks may help with domain learning, direct contribution may often be too difficult and might discourage newcomers from staying in the community and learn about its values.
The paper and this blog post are collaborative work between Ruijia “Regina” Cheng and Benjamin Mako Hill. The paper is being published this month(open access) in the Proceedings of the ACM on Human-Computer Interaction The full citation for this paper is: Ruijia Cheng and Benjamin Mako Hill. 2022. Many Destinations, Many Pathways: A Quantitative Analysis of Legitimate Peripheral Participation in Scratch. Proc. ACM Hum.-Comput. Interact. 6, CSCW2, Article 381 (November 2022), 26 pages https://doi.org/10.1145/3555106
The paper is also available as an arXiv preprint and in the ACM Digital Library. The paper is being presented several times at the Virtual CSCW conference taking place in November 2022. Both Regina and Mako are happy to answer questions over email, in the comments on this blog post, or at the one remaining presentation slot at the CSCW conference on November 16th at 8-9pm Pacific Time.
The conference will feature two new papers by collective students and faculty that were published in the journal Proceedings of the ACM on Human-Computer Interaction: CSCW.
Information on the talks as well as links to the papers are available here (CSCW members are listed in italics):
In addition, Benjamin Mako Hill is a panel co-chair.
Mako, Sohyeon, Jeremy, and Nathan will all be at the conference and so will tons of our social computing friends. Please come and say “Hello” to any of us and introduce yourself if you don’t already know us :)
Accurately estimating the quality of Wikipedia articles is important task for both researchers and Wikipedia community members. In a forthcoming paper in the Proceedings of the OpenSym 2021, I describe a new method for estimating article quality in Wikipedia in one dimension that builds on the widely used ORES quality model and that improves on the techniques researches have used to incorporate measures of quality into their studies of Wikipedia in the past. I will presenting virtually this week at the OpenSym 2021 conference. OpenSym is free and open to the public this year but requires registration.
Numerous efforts have gone into measuring the quality of Wikipedia articles and the Wikimedia Foundation maintains a machine learning model for measuring article quality on English Wikipedia called the ORES quality model. This model is trained on quality assessments conducted by members of WikiProjects that label articles into hierarchy of quality levels (i.e., stub, start-class, C-class, B-class, Good, Featured) and use boosted decision trees to predict the quality of versions of articles. This model is useful because it can predict the quality of versions of articles that haven’t been assessed. My OpenSym paper (teaser video, full presentation) builds on the ORES quality models to improve measuring Wikipedia article quality in one continuous dimension using ordinal regression models. A 1-D real-valued measure of quality is more granular and easier to use in downstream research. My method also increases the accuracy of quality prediction for units of analysis that are most important for research like articles or revisions and also estimates spacing between different levels of article quality.
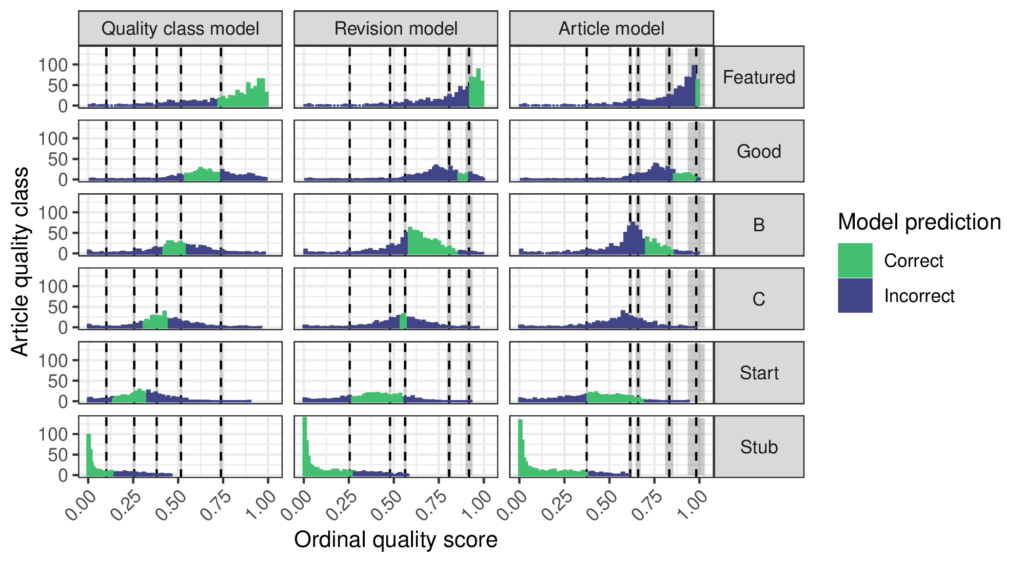
Quality scores and predictions of the ordinal regression models. Columns in the grid of charts correspond to the ordinal quality model calibrated to the indicated unit of analysis and rows correspond to sampled articles having the indicated level of quality as assessed by Wikipedians. Each chart shows the histogram of scores, thresholds inferred by the ordinal model with 95% credible intervals colored in gray, and colors indicating when the model makes correct or incorrect predictions. The thresholds are not evenly spaced, especially in revision model and article model that have more weight on lower quality classes. These two models infer that the gaps between Stub and Start and between Start and C-class articles are considerably wider than the gap between C-class and B-class articles.
An important limitation of the ORES quality models is that they do not output a single real-valued quality score. Instead, they output a multinomial distribution of the probability of an article’s quality class. This means that instead of saying “article X has quality 0.3” the model tells you “the probability of article X’s quality class is 0.1 for stub, 0.2 for start-class, 0.5 for C-class, 0.15 for B-class, 0.05 for Good and 0 for featured and the most probable quality class (MPQC) is C.” Using this kind of output in a downstream statistical analysis is kind of messy. For example, it might seem reasonable to use the MPQC as an integer-valued measure of quality, but this throws away information. Suppose ORES says that “the probability of article Y’s quality class is 0.00 for stub, 0.15 for start-class, 0.5 for C-class, 0.2 for B-class, 0.1 for Good, and 0.05 for Featured” According to the ORES quality model, Y probably has greater quality than X. Even though both have a MPQC of C-class, there’s a much greater change for article Y to be B-class or better than for article X. Is there a way to use the ORES probabilities to build a more granular measure of quality that accounts for this difference?
Aaron Halfaker, one of the creators of the ORES system, combined the probabilities into a 1-D score for one of his research projects by taking a weighed sum of the probabilities and assuming that Wikipedia article quality levels are “evenly spaced.” This creates a score out of the quality class probabilities by multiplying each probability by a weight so that probabilities for higher quality levels get more weight. He chose the weights [0,1,2,3,4,5] so an article gets 0 quality points for being a probable stub, 1 for the probability of being start-class, 2 for C-class, and so on with 5 points for Featured. This results in a nice continuous measure of quality that simplifies downstream statistical analysis. A number of others have followed his lead.
But how reasonable is the “evenly spaced” assumption that supports using the weights [0,1,2,3,4,5]? Could there be a way to pick weights to combine the ORES probabilities without using this assumption? My paper explains why ordinal regression is the right tool for the job and proposes a procedure for fitting an ordinal regression model to a sample representative of a unit of analysis like articles or revisions or quality classes that have been labeled by a WikiProject and scored by the ORES quality model. The ordinal regression predicts the quality labels as a function of the ORES scores and in this way finds a good way to combine the ORES scores into a single value. It also infers threshold parameters that define different regions of the quality score corresponding to quality classes and this allows the “evenly spaced” assumption to be tested. The figure above shows that the article quality levels are not evenly spaced! Interestingly, the way that they are unevenly spaced depends on how quality is measured. If the quality scale is designed to be accurate across all quality classes, then the quality levels are relatively even. However, if it is designed to be accurate for revisions or articles then more of the scale goes to lower levels of quality. Overall, the models agree that the difference between C-class and Start articles is smaller than that between the other levels.
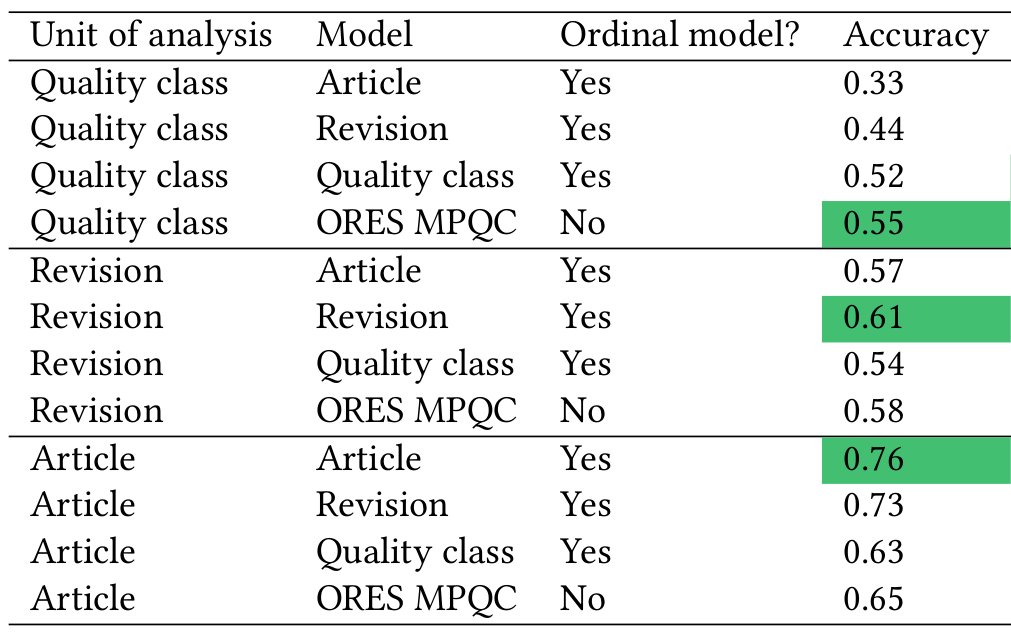
Using the quality scores based on ordinal regression also improves accuracy. This mostly comes from calibrating the ordinal model to the appropriate unit of analysis. The ORES quality model is fit on a “balanced” dataset where each quality class is equally represented. This means that the ORES quality model has learned that each quality class is equally likely to occur in the data. Of course, in reality lower quality articles are far more common than high quality articles. There are over 3,000,000 Stubs on English Wikipedia but less than 8,000 Featured articles. As the table below shows, fitting ordinal models that know the true proportion of each quality class in a sample can improve accuracy compared to the ORES quality model.
Accuracy of quality prediction models depends on the unit of analysis. The greatest accuracy scores are highlighted. Models are more accurate when calibrated on the same unit of analysis on which they are evaluated. Compared to the MPQC, the ordinal quality models have better accuracy when revisions or articles are the unit of analysis. When the quality class is the unit of analysis, the ordinal quality model has slightly worse accuracy.
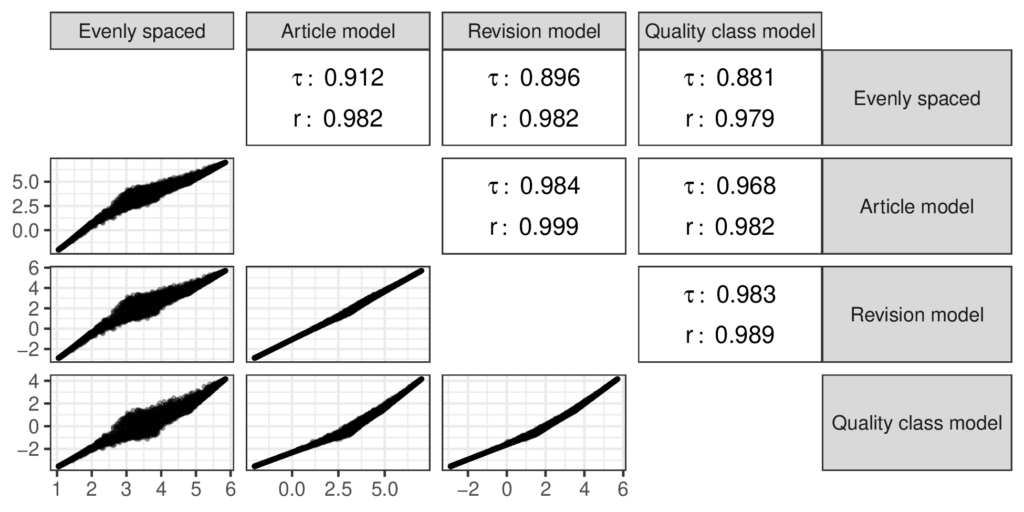
Even though my study has found evidence against the “evenly spaced” assumption, I also found that the quality scores based on it are strongly correlated with the scores from the ordinal model as shown in the figure below. The ‘𝜏’ symbols in the figure stand for the Kendall rank correlation coefficient while the ‘r’ symbols stand for the Pearson correlation coefficient. I used the Kendall correlation because it can capture nonlinear divergences between the measures and the Pearson coefficient is the familiar linear correlation. The “evenly spaced” scores aren’t totally in agreement with the scores from the ordinal models, but they are close enough that I doubt that prior research that used the “evenly spaced” scores to measure quality was mislead by this choice.
Correlations between quality measures show that the different approaches to measuring quality are quite similar. “Evenly spaced” uses the weighted sum of the ORES scores with handpicked coefficients [0,1,2,3,4,5]. Lower values of Kendall’s 𝜏, a nonparametric rank correlation statistic, compared to Pearson’s 𝑟 suggest nonlinear differences between the weighted sum and the other measures.
Conclusions
Measuring article quality in one continuous dimension is a valuable tool for studying the peer production of information goods because it provides granularity and is amenable to statistical analysis. Prior approaches extended ORES article quality prediction into a continuous measure under the “evenly spaced” assumption. I used ordinal regression models to transform the ORES predictions into a continuous measure of quality that is interpretable as a probability distribution over article quality levels, provides an account of its own uncertainty and does not assume that quality levels are “evenly spaced.” Calibrating the models to the chosen unit of analysis improves accuracy for research applications. I recommend that future work adopt this approach when article quality is an independent variable in a statistical analysis.
My paper also has a number of other tidbits about the uncertainty of different quality measures, the importance of feedback between measurement and knowledge in the scientific process and demonstrates model calibration.
A preprint of the paper is available here. The paper has been accepted to OpenSym 2021 and will be presented at the virtual conference on September 17th. A video of the presentation is available here. A dataverse repository containing code and data from the project is available here.
Millions of young people from around the world are learning to code. Often, during their learning experiences, these youth are using visual block-based programming languages like Scratch, App Inventor, and Code.org Studio. In block-based programming languages, coders manipulate visual, snap-together blocks that represent code constructs instead of textual symbols and commands that are found in more traditional programming languages.
The textual symbols used in nearly all non-block-based programming languages are drawn from English—consider “if” statements and “for” loops for common examples. Keywords in block-based languages, on the other hand, are often translated into different human languages. For example, depending on the language preference of the user, an identical set of computing instructions in Scratch can be represented in many different human languages:
Although my research with Benjamin Mako Hill focuses on learning, both Mako and I worked on local language technologies before coming back to academia. As a result, we were both interested in how the increasing translation of programming languages might be making it easier for non-English speaking kids to learn to code.
After all, a large body of education research has shown that early-stage education is more effective when instruction is in the language that the learner speaks at home. Based on this research, we hypothesized that children learning to code with block-based programming languages translated to their mother-tongues will have better learning outcomes than children using the blocks in English.
We sought to test this hypothesis in Scratch, an informal learning community built around a block-based programming language. We were helped by the fact that Scratch is translated into many languages and has a large number of learners from around the world.
To measure learning, we built on some of our our own previous work and looked at learners’ cumulative block repertoires—similar to a code vocabulary. By observing a learner’s cumulative block repertoire over time, we can measure how quickly their code vocabulary is growing.
Using this data, we compared the rate of growth of cumulative block repertoire between learners from non-English speaking countries using Scratch in English to learners from the same countries using Scratch in their local language. To identify non-English speakers, we considered Scratch users who reported themselves as coming from five primarily non-English speaking countries: Portugal, Italy, Brazil, Germany, and Norway. We chose these five countries because they each have one very widely spoken language that is not English and because Scratch is almost fully translated into that language.
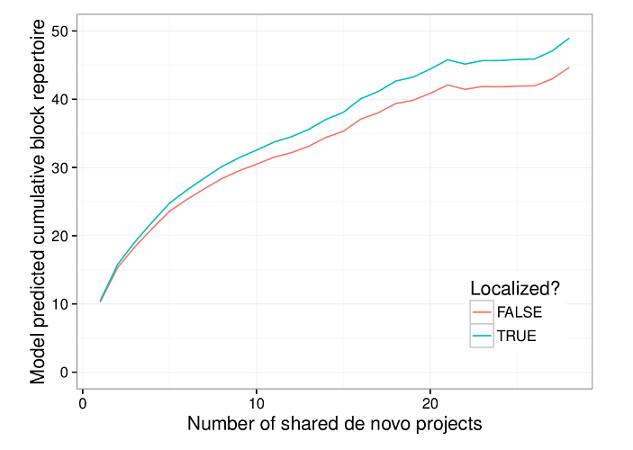
Even after controlling for a number of factors like social engagement on the Scratch website, user productivity, and time spent on projects, we found that learners from these countries who use Scratch in their local language have a higher rate of cumulative block repertoire growth than their counterparts using Scratch in English. This faster growth was despite having a lower initial block repertoire. The graph below visualizes our results for two “prototypical” learners who start with the same initial block repertoire: one learner who uses the English interface, and a second learner who uses their native language.
Our results are in line with what theories of education have to say about learning in one’s own language. Our findings also represent good news for designers of block-based programming languages who have spent considerable amounts of effort in making their programming languages translatable. It’s also good news for the volunteers who have spent many hours translating blocks and user interfaces.
Although we find support for our hypothesis, we should stress that our findings are both limited and incomplete. For example, because we focus on estimating the differences between Scratch learners, our comparisons are between kids who all managed to successfully use Scratch. Before Scratch was translated, kids with little working knowledge of English or the Latin script might not have been able to use Scratch at all. Because of translation, many of these children are now able to learn to code.
This blog-post and the work that it describes is a collaborative project with Benjamin Mako Hill. You can read our paper here. The paper was published in the ACM Learning @ Scale Conference. We also recently gave a talk about this work at the International Communication Association’s annual conference. We have received support and feedback from members of the Scratch team at MIT (especially Mitch Resnick and Natalie Rusk), as well as from Nathan TeBlunthuis at the University of Washington. Financial support came from the US National Science Foundation.
I’m pleased to announce the Community Data Science Collective Dataverse. Our dataverse is an archival repository for datasets created by the Community Data Science Collective. The dataverse won’t replace work that collective members have been doing for years to document and distribute data from our research. What we hope it will do is get our data — like our published manuscripts — into the hands of folks in the “forever” business.
Over the past few years, the Community Data Science Collective has published several papers where an important part of the contribution is a dataset. These include:
In the case of each of the first groups of papers where the dataset was a part of the contribution, we uploaded code and data to a website we’ve created. Of course, even if we do a wonderful job of keeping these websites maintained over time, eventually, our research group will cease to exist. When that happens, the data will eventually disappear as well.
The text of our papers will be maintained long after we’re gone in the journal or conference proceedings’ publisher’s archival storage and in our universities’ institutional archives. But what about the data? Since the data is a core part — perhaps the core part — of the contribution of these papers, the data should be archived permanently as well.
Toward that end, our group has created a dataverse. Our dataverse is a repository within the Harvard Dataverse where we have been uploading archival copies of datasets over the last six months. All five of the papers described above are uploaded already. The Scratch dataset, due to access control restrictions, isn’t listed on the main page but it’s online on the site. Moving forward, we’ll be populating this new datasets we create as well as replication datasets for our future empirical papers. We’re currently preparing several more.
The primary point of the CDSC Dataverse is not to provide you with way to get our data although you’re certainly welcome to use it that way and it might help make some of it more discoverable. The websites we’ve created (like for the ones for redirects and for page protection) will continue to exist and be maintained. The Dataverse is insurance for if, and when, those websites go down to ensure that our data will still be accessible.
As children use digital media to learn and socialize, others are collecting and analyzing data about these activities. In school and at play, these children find that they are the subjects of data science. As believers in the power of data analysis, we believe that this approach falls short of data science’s potential to promote innovation, learning, and power.
Motivated by this fact, we have been working over the last three years as part of a team at the MIT Media Lab and the University of Washington to design and build a system that attempts to support an alternative vision: children as data scientists. The system we have built is described in a new paper—Scratch Community Blocks: Supporting Children as Data Scientists—that will be published in the proceedings of CHI 2017.
Our system is built on top of Scratch, a visual, block-based programming language designed for children and youth. Scratch is also an online community with over 15 million registered members who share their Scratch projects, remix each others’ work, have conversations, provide feedback, bookmark or “love” projects they like, follow other users, and more. Over the last decade, researchers—including us—have used the Scratch online community’s database to study the youth using Scratch. With Scratch Community Blocks, we attempt to put the power to programmatically analyze these data into the hands of the users themselves.
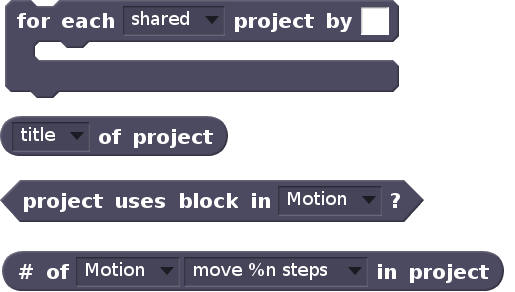
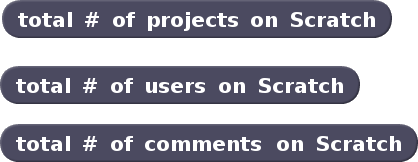
To do so, our new system adds a set of new programming primitives (blocks) to Scratch so that users can access public data from the Scratch website from inside Scratch. Blocks in the new system gives users access to project and user metadata, information about social interaction, and data about what types of code are used in projects. The full palette of blocks to access different categories of data is shown below.
Project metadataUser metadataSite-wide statistics
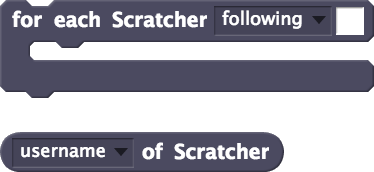
The new blocks allow users to programmatically access, filter, and analyze data about their own participation in the community. For example, with the simple script below, we can find whether we have followers in Scratch who report themselves to be from Spain, and what their usernames are.
Simple demonstration of Scratch Community Blocks
In designing the system, we had two primary motivations. First, we wanted to support avenues through which children can engage in curiosity-driven, creative explorations of public Scratch data. Second, we wanted to foster self-reflection with data. As children looked back upon their own participation and coding activity in Scratch through the project they and their peers made, we wanted them to reflect on their own behavior and learning in ways that shaped their future behavior and promoted exploration.
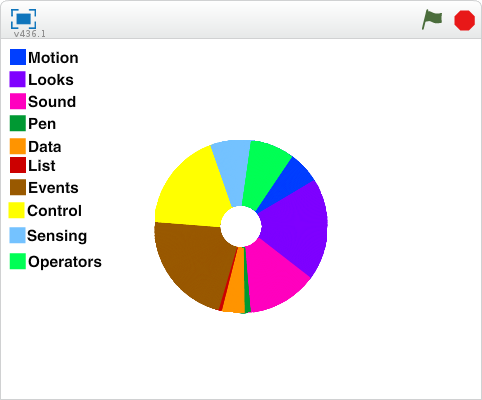
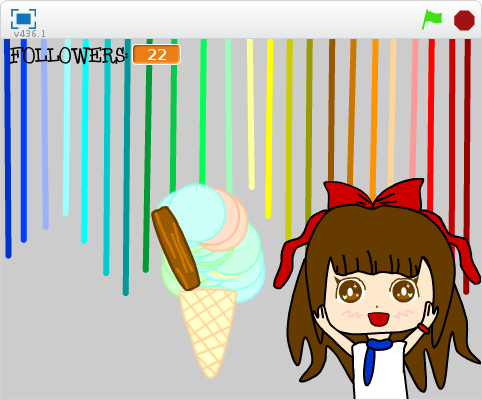
After designing and building the system over 2014 and 2015, we invited a group of active Scratch users to beta test the system in early 2016. Over four months, 700 users created more than 1,600 projects. The diversity and depth of users creativity with the new blocks surprised us. Children created projects that gave the viewer of the project a personalized doughnut-chart visualization of their coding vocabulary on Scratch, rendered the viewer’s number of followers as scoops of ice-cream on a cone, attempted to find whether “love-its” for projects are more common on Scratch than “favorites”, and told users how “talkative” they were by counting the cumulative string-length of project titles and descriptions.
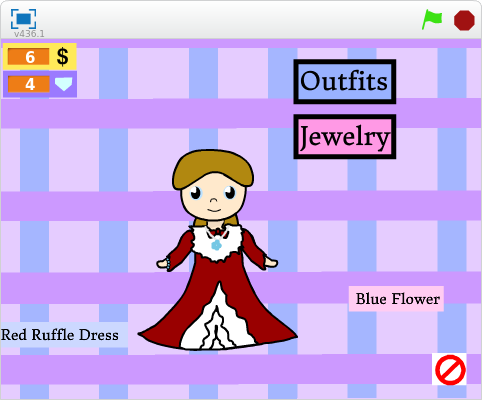
We found that children, rather than making canonical visualizations such as pie-charts or bar-graphs, frequently made information representations that spoke to their own identities and aesthetic sensibilities. A 13-year-old girl had made a virtual doll dress-up game where the player’s ability to buy virtual clothes and accessories for the doll was determined by the level of their activity in the Scratch community. When we asked about her motivation for making such a project, she said:
I was trying to think of something that somebody hadn’t done yet, and I didn’t see that. And also I really like to do art on Scratch and that was a good opportunity to use that and mix the two [art and data] together.
We also found at least some evidence that the system supported self-reflection with data. For example, after seeing a project that showed its viewers a visualization of their past coding vocabulary, a 15-year-old realized that he does not do much programming with the pen-related primitives in Scratch, and wrote in a comment, “epic! looks like we need to use more pen blocks. :D.”
Doughnut visualizationIce-cream visualizationData-driven doll dress up
Additionally, we noted that that as children made and interacted with projects made with Scratch Community Blocks, they started to critically think about the implications of data collection and analysis. These conversations are the subject of another paper (also being published in CHI 2017).
In a 1971 article called “Teaching Children to be Mathematicians vs. Teaching About Mathematics”, Seymour Papert argued for the need for children doing mathematics vs. learning about it. He showed how Logo, the programming language he was developing at that time with his colleagues, could offer children a space to use and engage with mathematical ideas in creative and personally motivated ways. This, he argued, enabled children to go beyond knowing about mathematics to “doing” mathematics, as a mathematician would.
Scratch Community Blocks has not yet been launched for all Scratch users and has several important limitations we discuss in the paper. That said, we feel that the projects created by children in our the beta test demonstrate the real potential for children to do data science, and not just know about it, provide data for it, and to have their behavior nudged and shaped by it.
This blog-post and the work that it describes is a collaborative project between Sayamindu Dasgupta and Benjamin Mako Hill. We have also received support and feedback from members of the Scratch team at MIT (especially Mitch Resnick and Natalie Rusk), as well as from Hal Abelson from MITCSAIL. Financial support came from the US National Science Foundation. We will be presenting this paper at CHI in May, and will be thrilled to talk more about our work and about future directions.