This post is about my (Nathan TeBlunthuis) paper (pdf) just published at ICWSM 2025.
Often, several different online communities exist where similar people talk about similar things. This is really easy to observe from browsing platforms like Reddit or Facebook groups.
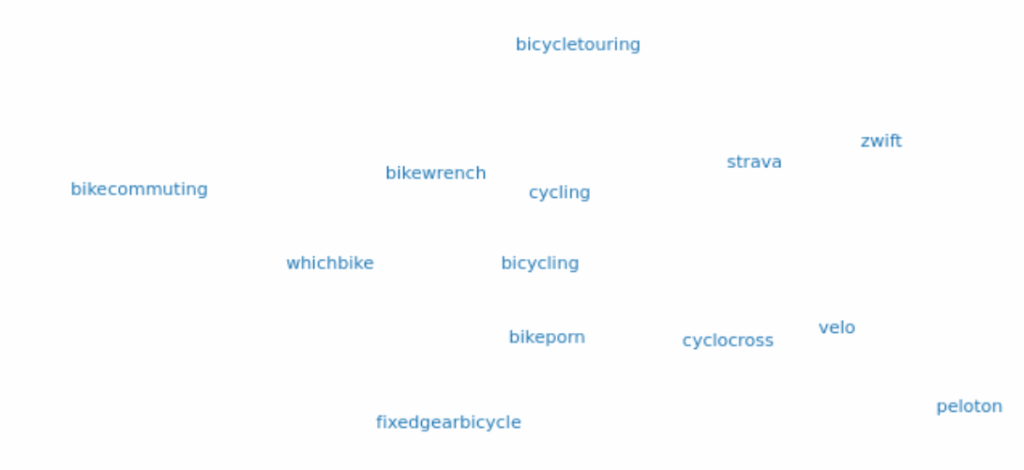
For example, as we can see from this visualization of clustered subreddits with overlapping users, there are many different subreddits related to cycling. We see some communities have different emphases in complementary ways like “fixedgearbicycle” and “bicycletouring” — these are different types of cycling. But why have a community for
“cycling” and a different one for “bicycling”? A number of puzzles appear when we reflect on the existence of such related communities.
How do online communities relate to each other?
Why not have one large community that does everything?
How do people construct these systems of related online communities?
I investigated these questions in my dissertation using the theoretical lens of organizational ecology drawn from organizational sociology. This new paper explored some findings from earlier projects in more depth. The paper I published in ICWSM 2022 (pdf), takes up the question of ecological relationships among online communities. I used time series models to infer networks of competition and mutualism between overlapping online communities. This work found evidence that they tended to be mutualistic. For example, the diagram below shows a network of mental health subreddits that is dense with mutualism.
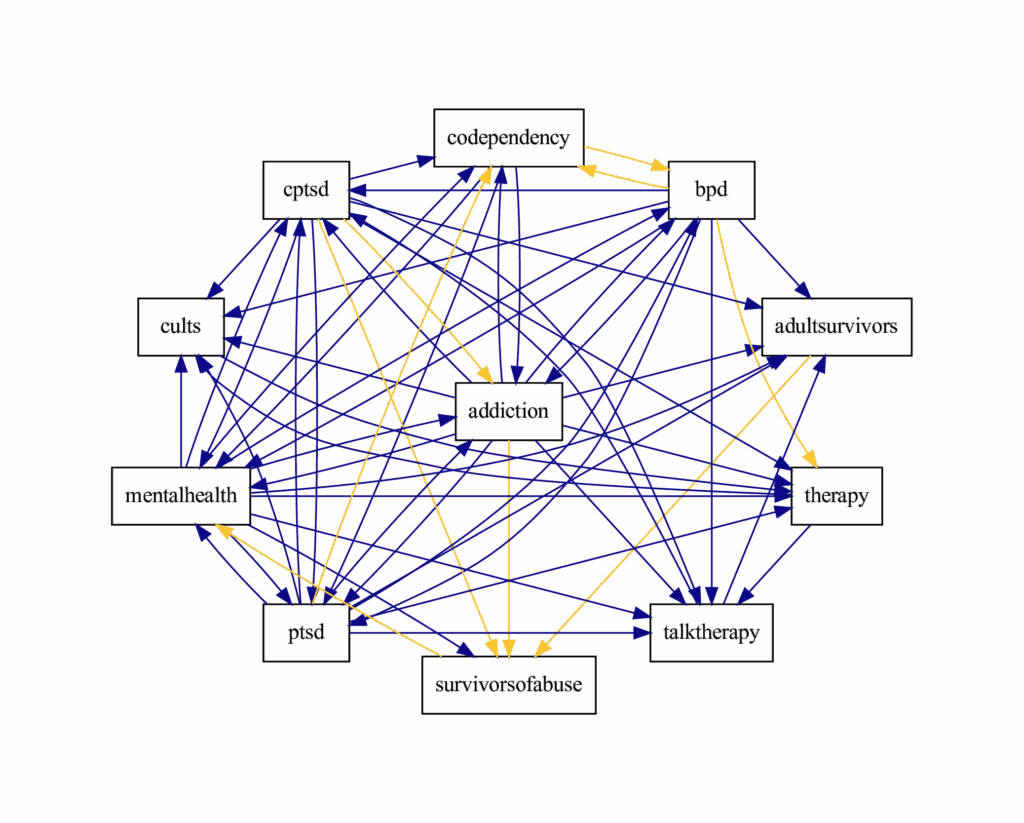
However, this method, based on vector autoregression (VAR) models of activity, assumes that these relationships are static and constant over time. But dynamics of attention online are often bursty, and online communities grow, decline, and change over time in other ways. So, in this new work, I adopted nonlinear models called (regularized) S-map that can model more complex dynamics.
Since I found in the previous work that mutualism tended to happen more often than competition, I wanted to find out if that result was robust using the S-map. Since the S-map breaks these relationships down into episodes of competition or mutualism it afforded testing a more nuanced hypothesis about this tendency towards mutualism.
H1: Mutualistic interactions will be more frequent and longer lasting than competitive interactions.
In the another empirical paper previously published at CSCW 2022 (acm dl), we focused on the question of why people build overlapping online communities and found that they complementary sets of benefits to members, as illustrated below. Trade-offs between the benefits lead to specialized roles for different types of communities.
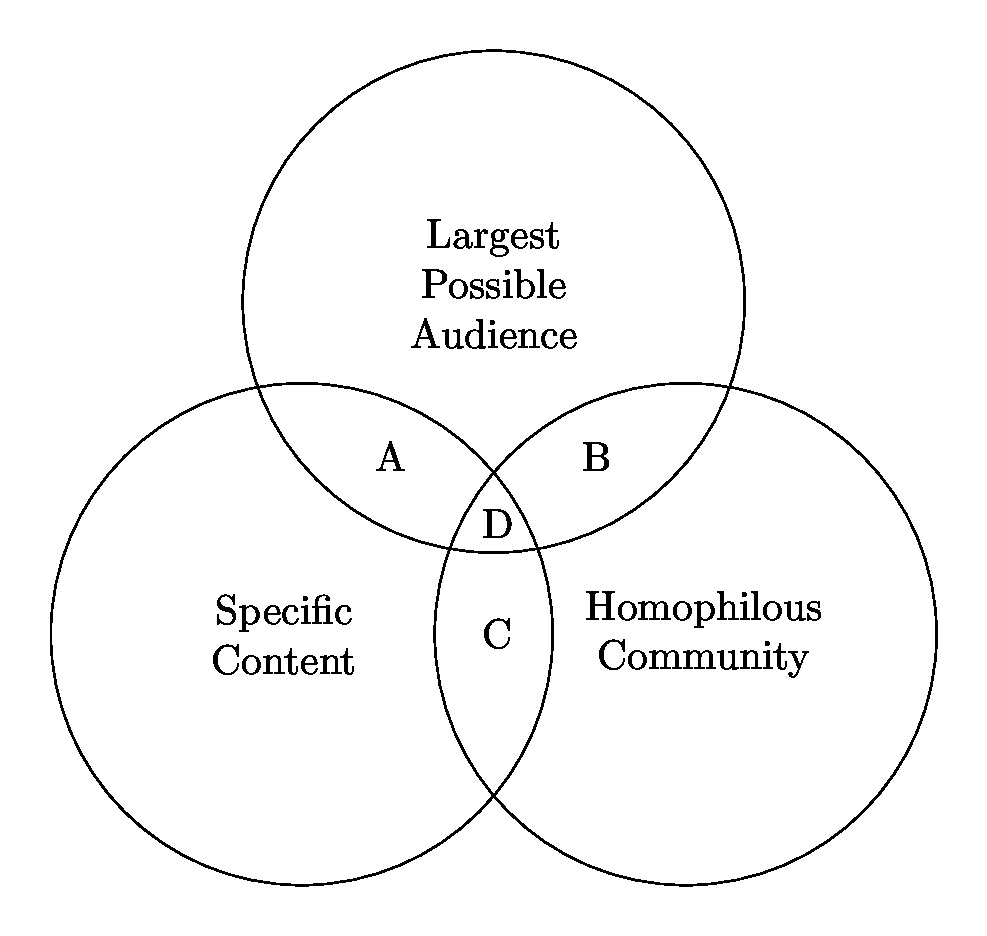
This reflects propositions from ecology that specialization can be a strategy to avoid competition. The new study seeks to provide more generalizable quantitative evidence about how online communities find their specialized niches. Ecology theory suggests that online communities, similar to organizations or organisms, might adapt to increase specialization and thereby promote more mutualistic relationships. To investigate whether people build specialized online communities through such an adaptive feedback process, I set out to test the following two hypotheses:
H2: Two communities having greater competition (mutualism) will subsequently have greater decreases (increases) in overlap.
H3: Two subreddits having decreasing (increasing) overlap will subsequently have greater mutualism (competition).
Methods and measures
To test these three hypotheses, I had to measure competition/mutualism, and overlap within clusters of related subreddits over time. I made topic- and user-overlap measures based on a community embedding via the LSA algorithm. To create the clusters I reused the approach from the earlier paper by using the HDBSCAN algorithm based on user overlap. As mentioned above I used the Regularized S-MAP algorithm to create a dynamic measure of ecological influence. With these longitudinal measures in hand I could test the hypotheses using two-way fixed-effects panel data estimators with dyad-robust standard errors. That’s a brief and dense summary of the methods. The chart below might help you make sense of it, but if you care to fully understand you’ll want to check out the full paper.
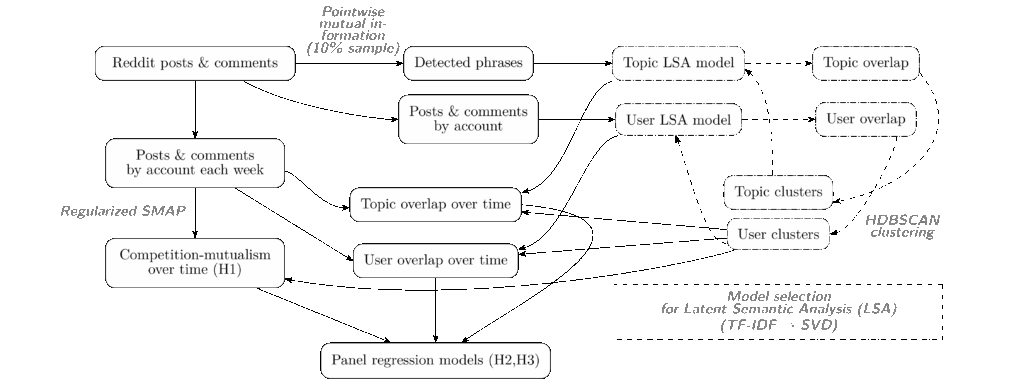
On the left-hand side, nonline “Regularized S-Map models” are fit to time series of posts and comments in clusters of subreddits with high user-overlap to test hypothesis 1.
In the middle, competition and mutualism from the S-Map models are used with longitidunal measures of topic and user overlap based on community embeddings in panel regression models to test hypotheses 2 and 3.
Model selection is on the right-hand side.
Here are a few final notes on the data and methods. The data came from the Pushshift Reddit archive of submissions and comments from December 5th 2015 to April 13th 2020. I Started with the 19,533 subreddits that were active during at least 20% of study period weeks, excluding NSFW subreddits. HDBSCAN clustering discovered related 1,919 clusters of 8,806 subreddits having 48,484 relationships measured 17,374,116 times over 758 weeks.
Results
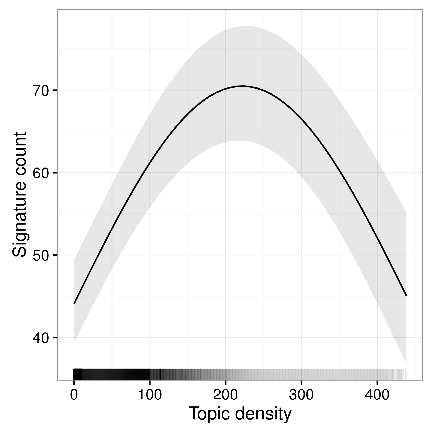
I found support for H1, which predicted that mutualistic interactions will be more frequent and longer lasting than competitive interactions. The plot below shows evidence in favor of the hypothesis. First, we can see clearly that the longest episodes tend to be mutualistic.
Notably, these ecological relationships are often bursty and short-lived. The average length of a mutualistic episode was 2.13 weeks and the average length of a competitive episode was just 1.83 weeks.
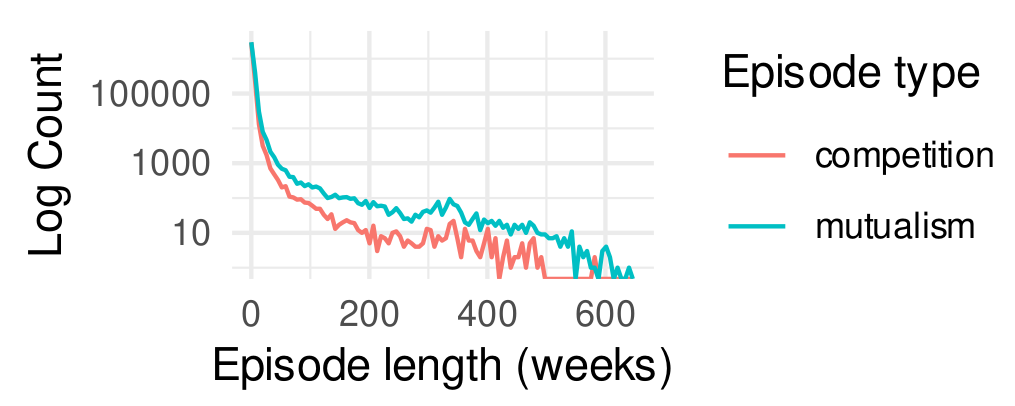
competition. The y-axis is log-transformed. The axes truncated to omit outliers for visibility.
I also found support for H2, which predicted that I’d find positive coefficients for previous ecological interaction indicating that competition predicts decreases in overlap. Indeed, the panel regression models found that online communities tend to increase their specialization a bit in relatively competitive conditions, by about 0.02 standard deviations in term or user overlap for every 1-unit increase in competition.
Do increasingly specialized communities tend to decrease their competition as predicted by H3? My analysis didn’t find evidence for this. In fact, according to the panel regression models, after specialization increases, competition actually tends to increase as well.
Discussion
What to take away from all this? I still think the most important finding from this work to me is the robustness of the tendency toward mutualism among online communities. Unlike firms or other organizations that demand relatively exclusive commitments from their members, it is easy to participate in many online communities. Where classical organizations (imagine firms, churches, sports teams, nonprofit, and state organizations) seem likely to compete over employees, customers, or members online communities seem to benefit to some extant from sharing users with each other. I suspect this has to do with the ease with which nonrival content, ideas, and knowledge move between communities.
A second important takeaway from this work is that I think the evidence it finds for the adaptation explanation for the tendency toward mutualism isn’t all that convincing. Sure, communities in competition tend to become more specialized, but the effect size is pretty small and the fact that specialization doesn’t reduce competition suggests that it isn’t truly adaptive in the strongest sense. Put another way, specialized online communities might be made via an adaptive process, or they might be born out of the intentions and designs of their founders and early joiners. This work finds a bit of evidence for how specialization might be made, but the born process merits more investigation.
One clue about the significance of design for specialization comes from fellow CDSC-er Jeremy Foote‘s a nice CHI paper (acm dl) last year on how the early stages of a subreddit’s development are important to its trajectory and found that most subreddit creators didn’t set out to create a large community. Another study (arxiv.org), by Chenhao Tan on “community genealogy” shows how the growth of new subreddits often seems to depend on having high overlap with a “parent” subreddit. These papers don’t focus on specialization, but it would be cool to see future work take up these ideas.
If you enjoyed reading this summary or want to learn more, please check out the full paper. I got the chance to speculate a bit about what sorts of future technology designs might assist community leaders in crafting online communities to fill ecological roles. I also got to engage with ecological theory in a new way writing this. I hope you read and enjoy.
Finally, I wasn’t able to attend ICWSM in person this year, so I want to thank Kristen Engel for presenting on my behalf. I also want to note that CDSC-er Kaylea Champion and I were both recognized as “best reviewers” at the conference.
This work started as a chapter of my dissertation. Thanks to the committee — Professors Benjamin Mako Hill, Kirsten Foot, Aaron Shaw, David McDonald and Emma Spiro.
I also gratefully acknowledge support by NSF grants IIS-1908850 and IIS-1910202 and GRFP \#2016220885. This work was facilitated through the use of the advanced computational infrastructure provided by the Hyak supercomputer system at the University of Washington and TACC at the University of Texas.
 A good chunk of the collective is heading to San Diego this week for the 2017 international communication association conference.