Women in Data Science Puget Sound is part of a 50+-country conference series founded and organized in cooperation with Stanford University’s Data Science coalition. Anyone may attend, regardless of gender: events feature a speaker lineup composed of women in data science. The Puget Sound event is Tuesday, April 25 at the Expedia HQ in Seattle, and numerous affiliated regional and online events are scheduled in the coming weeks.
If you’re in the Seattle area, you might like to catch CDSC member Kaylea presenting a workshop! Here’s the pitch for attending her beginner-friendly session:
Let’s Re-think Political Bias & Build Our Own Classifier
How can we think about political bias without falling into assumptions about who's on what side and what that means?
Data science and ML offer us an alternative: we can parse political speech about a topic and use NLP/ML techniques to classify articles we scrape from the web.
In this hands-on workshop, we'll parse the Congressional Record, build a classifier, scrape search results, and analyze texts. You'll walk away with your own example of how to use data science to analyze political framing.
The full lineup of speakers for the Puget Sound conference is posted here. Tickets for the single-day event are $80 (see this link to request a discount code for half off).
Topics on the schedule for this event look juicy if quant work is your jam: AI, BERT, hypergraphs, visualization, forecasting, quantum computing, causal inference, survival analysis, writing better code and career management, with examples ranging from search, sales, and supply chain to economic disparity, DNA sequencing and saving wildlife!
Thousands of widely used online communities are designed to promote learning. Although some rely on formal educational approaches like lesson plans, curriculum, and tests, many of the most successful learning communities online are structured as what scholars call a community of practice (CoP). In CoPs, members mentor and apprentice with each other (both formally and informally) while working toward a common interest or goal. For example, the Scratch online community is a CoP where millions of young people share and collaborate on programming projects.
Despite an enormous amount of attention paid to online CoPs, there is still a lot of disagreement about the best ways to promote learning in them. One source of disagreement stems from the fact that participants in CoPs are learning a number of different kinds of things and designers are often trying to support many types of learning at once. In a new paper that I’ve published—and that I will be presenting at CSCW this week—I conduct quantitative analyses on data from Scratch to show that there is a complex set of learning pathways at play in CoPs like Scratch. Types of participation that are associated with some important kinds of learning are often unrelated to, or even negatively associated with, other important types of learning outcomes.
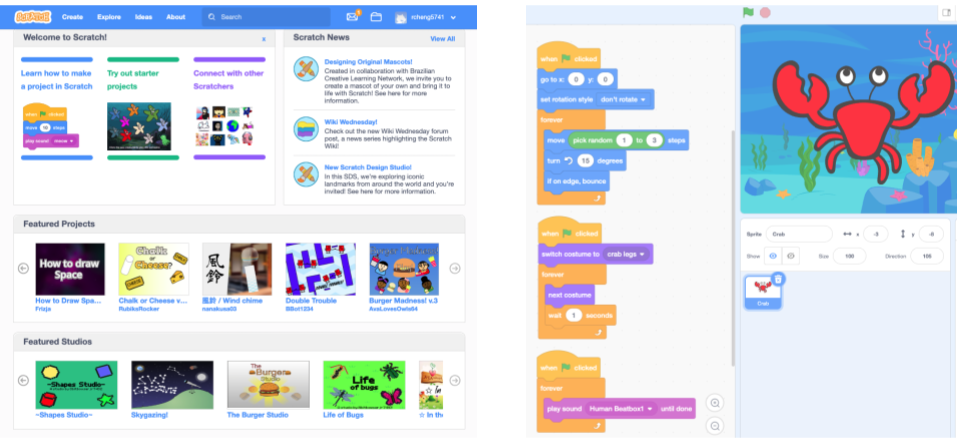
The Scratch online community (left) and an example of a programming project in Scratch (right).
So what exactly are people learning in CoPs? We dug into the CoP literature and identified three major types of learning outcomes:
Learning about the domain, which refers to learning knowledge and skills for the core tasks necessary for achieving the explicit goal in the community. In Scratch, this is learning to code.
Learning about the community, which means the development of identity as a community member, forming relationships, affinities, and a sense of belonging. In Scratch, this involves learning to interact with others users and developing an identity as a community member.
Learning about the practice, which means adopting community specific values, such as the style of contribution that will be accepted and appreciated by its members. In Scratch, this means becoming a valued and respected contributor to the community.
So what types of participation might contribute to learning in a CoP? We identified several different types of newcomers’ participation that may support learning:
Contribution to core tasks which involves direct work towards the community’s explicit goal. In Scratch, this often involves making original programming projects.
Engagement with practice proxies which involves observing and participating in others’ work practices. In Scratch, this might mean remixing others’ projects by making changes and building on existing code.
Feedback exchange with community members about their contributions. In Scratch, this often involves writing comments on others’ projects.
Social bonding with community members. In Scratch, this can involve “friending” others, which allows a user to follow others’ projects and updates.
A visual representation of our study design.
We conducted a quantitative analysis on how the different types of newcomer participation contribute to the different learning outcomes. In other words, we tested for the presence/absence and the direction of the relationships (shown as the orange arrows) between each of the learning outcomes on the top of the figure and each of the types of newcomer participation on the bottom. To conduct these tests, we used data from Scratch to construct a user level dataset with proxy measures for each type of learning and type of newcomer participation as well as a series of important control variables. All the technical details about the measures and models are in the paper.
Overall, what we found was a series of complex trade-offs that suggest the kinds of things that support one type of learning frequently do not support others. For example, we found that contribution to core tasks as a newcomer is positively associated with learning about the domain in the long term, but negatively associated with learning about the community and its practices. We found that engagement with practice proxies as a newcomer is negatively associated with long-term learning about the domain and the community. Engaging in feedback exchange and social bonding as a newcomer, on the other hand, are positively associated with learning about the community and its practice.
Our findings indicate that there are no easy solutions: different types of newcomer participation provide varying support for different learning outcomes. What is productive for some types of learning outcomes can be unhelpful for others, and vice versa. For example, although social features like feedback mechanisms and systems for creating social bonds may not be a primary focus of many learning systems, they could be implemented to help users develop a sense of belonging in the community and learn about community specific values. At the same time, while contributing to core tasks may help with domain learning, direct contribution may often be too difficult and might discourage newcomers from staying in the community and learn about its values.
The paper and this blog post are collaborative work between Ruijia “Regina” Cheng and Benjamin Mako Hill. The paper is being published this month(open access) in the Proceedings of the ACM on Human-Computer Interaction The full citation for this paper is: Ruijia Cheng and Benjamin Mako Hill. 2022. Many Destinations, Many Pathways: A Quantitative Analysis of Legitimate Peripheral Participation in Scratch. Proc. ACM Hum.-Comput. Interact. 6, CSCW2, Article 381 (November 2022), 26 pages https://doi.org/10.1145/3555106
The paper is also available as an arXiv preprint and in the ACM Digital Library. The paper is being presented several times at the Virtual CSCW conference taking place in November 2022. Both Regina and Mako are happy to answer questions over email, in the comments on this blog post, or at the one remaining presentation slot at the CSCW conference on November 16th at 8-9pm Pacific Time.
Workshop Report From Connected Learning Summit 2021
What are data literacies? What should they be? How can we best support youth in developing them via future tools? On July 13th and July 15th 2021, we held a two-day workshop at the Connected Learning Summit to explore these questions. Over the course of two very-full one-hour sessions, 40 participants from a range of backgrounds got to know each other, shared their knowledge and expertise, and engaged in brainstorming to identify important pressing questions around youth data literacies as well as promising ways to design future tools to support youth in developing them. In this blog post, we provide a full report from our workshop, links to the notes and boards we created during the workshop, and a description of how anyone can get involved in the community around youth data literacies that we have begun to build.
Caption: We opened our sessions by encouraging participants to share and synthesize what youth data literacies meant to them. This affinity diagram is the result.
How this workshop came to be
As part of the research team interested in research about learning at the Community Data Science Collective, we have long been fascinated with how youth and adults learn how to ask and answer questions with data While we have engaged with these questions ourselves by looking to Scratch and Cognimates, we are always curious about how we might design tools to promote youth data literacies in the future in other contexts.
The Connected Learning Summit is a unique gathering of practitioners, researchers, teachers, educators, industry professionals, and others, all interested in formal and informal learning and the impact of new media on current and future communities of learners. When the Connected Learning Summit put up a call for workshops, we thought this was a great opportunity to engage the broader community on the topic of youth data literacies.
Several months ago, the four of us (Stefania, Regina, Emilia and Mako) started to brainstorm ideas for potential proposals. We started by listing potential aspects and elements of data literacies such as: finding & curating data, visualizing & analyzing it, programming with data, and engaging in critical reflection. We then started to identify tools that can be used to accomplish each goal and tied to identify opportunities and gaps. See some examples of these tools on our workshop website.
As part of this process, we identified a number of leaders in the space. This included people who have built tools like Rahul Bhargava and Catherine D’Ignazio who designed Databasic.io,Andee Rubinwho contributed to CODAP, and Victor Lee who focused on tools that link personal informatics and data. Other leaders included scholars who researched how existing tools are being used to support data literacies, including Tammy Clegg who has researched how college athletes develop data literacy skills, Yasmin Kafai who has looked at e-textile projects, and Camillia Matuk who has done research on data literacy curricula. Happily, all of these leaders agreed to join us as co-organizers for the workshop.
The workshop and what we learned from it
Our workshop took place on July 13th and July 15th as part of the 2021 Connected Learning Summit. Participants came from diverse backgrounds and the group included academic researchers, industry practitioners, K-12 teachers, and librarians. On the first day we focused on exploring existing learning scenarios designed to promote youth data literacies. On the second day we built on big questions raised in the initial session and brainstormed features for future systems. Both workshop sessions were composed of several breakout sessions. We took notes in a shared editor and encouraged participants to add their ideas and comments on sticky notes on collaborative digital white boards and share their definitions and questions around data literacies.
Caption: organizers and participants sharing past projects and ideas in a breakout session.
Day 1 Highlights
On Day 1, we explored a variety of existing tools designed to promote youth data literacies. We had a total of 28 participants who attended the session. We began with a group exercise where we shared their own definitions of youth data literacies before dividing into 3 groups: a group focusing on tools for data visualization and storytelling, a group focusing on block-based tools, and a group focusing on data literacy curricula. In each breakout session, our co-organizers first demonstrated one or two existing tools. Each group then discussed how the demo tool might support a single learning scenario based on the following prompt: “Imagine a six-grader who just learned basic concepts about central tendency, how might she use these tools to apply this concept on real world data?” Each group generated many reflective questions and ideas that would prompt and help inform the design of future data literacies tools. Results of our process are captured in the boards linked below.
Caption: Activities on Miro boards during the workshop.
Data visualization and storytelling
Click here to see the activities on Miro board for this breakout session.
In the sub-section focusing on data visualization and storytelling, Victor Lee first demonstrated Tinkerplots, a desktop-based software that allows students to explore a variety of visualizations with simple click-button interaction using data in .csv format. Andee Rubin then demonstrated CODAP, a web-based tool similar to Tinkerplots that supports drag-and-drop with data, additional visual representation options including maps, and connection between representations.
Caption: CODAP and Tinkerplots—two tools demonstrated during the workshop.
We discussed how various features of these tools could support youth data literacies in specific learning scenarios. We saw flexibility as one of the most important factors in tool use, both for learners and teachers. Both tools are topic-agnostic and compatible with any data in .csv format. This allows students to explore data of any topics that interest them. Simplicity in interaction is another important advantage. Students can easily see the links between tabular data and visualizations and try out different representations using simple interactions like drag-and-drop, check boxes, and button clicks. Features of these tools can also support students in performing aggregation on data and telling stories about trends and outliers.
We further discussed potential learning needs beyond what the current features could support. Before creating visualizations, students may need scaffolds during the process of data collection, as well as in the stage of programming with and preprocessing data. Story telling about the process of working with data was another theme that came up a lot from our discussion. Open questions include how features can be designed to support reproducibility, how we can design scaffolds for students to explain what they are doing with data in diary style stories, and how we can help students narrate what they think about a dataset and why they generate particular visualizations.
Block-based tools
Click here to see the activities on Miro board for this breakout session.
The breakout section about block-based tools started with PhD candidate Stefania Druga demonstrating a program in Scratch and how users could interact with data using the Scratch Cloud Data. We brainstormed about the kind of data students could collect and explore and the kind of visualization, game-based, or other creative interactions youth could create with the help of block-based tools. As a group, we came up with many creative ideas. For example, students can collect and visualize “the newest COVID tweet at the time you touched” a sensor and make “sound effect every time you count a face-touch.”
Caption: A Scratch project demonstrated during the workshop made with Cloud Data.
We discussed how interaction with data was part of an enterprise that is larger than any particular digital scaffold. After all, data exploration is embedded in social context and might reflect hot topics and recent trends. For instance, many of our ideas about data explorations were around COVID-19 related data and topics.
Our group also felt that interaction with data should not be limited to a single digital software. Many scenarios we came up with were centered on personal data collection in physical spaces (e.g., counting the number of times a student touches their own face). This points to a future design direction of how we can connect multiple tools that support interaction in both digital and physical spaces and encourage students to explore questions using different tools.
A final theme from our discussion was around how we can use block-based tools to allow engagement with data among a wider audience. For example, accessible and interesting activities and experience with block-based tools could be designed so that librarians can get involved in meaningful ways to introduce people to data.
Data literacy curriculum
Click here to see the activities on Miro board for this breakout session.
In the breakout section emphasizing on curriculum design, we started with an introduction by Catherine D’Ignazio and Rahul Bhargava on DataBasic.io’s Word Counter: a tool that allows users to paste in text to see word counts in various ways. We also walked through some curricula that the team created to guide students through the process of telling stories with data.
We talked about how this design was powerful in that it allows students to bring their own data and context, and to share knowledge about what they expect to find. Some of the scenarios we imagined included students analyzing their own writings, favorite songs, and favorite texts, and how they might use data to tell personalized stories from there. The specificity of the task supported by the tool enables students to deepen concepts about data by asking specific questions and looking at different datasets to explore the same question.
Caption: dataBASIC.io helps users explore data.
We also reflected on the fact that tools provided in Databasic.io are easy to use precisely because they are quite narrowly focused on a specific analytic task. This is a major strength of the tools, as they are intended as transitional bridges to help users develop foundational skills for data analysis. Using these tools should help answer questions, but should also encourage users to ask even more.
This led to a new set of issues discussed during the breakout session: How do we chain collections of small tools that might serve as one part of a data literacies pipeline together? This is where we felt curricular design could really come into play. Rather than having tools that try to “be everything,” using well-designed tools that address one aspect of an analysis can provide more flexibility and freedom to explore. Our group felt that curriculum can help learners reach the most important step in their learning, going from data to story to the bigger world—and to understanding why the data might matter.
Day 2 Highlights
The goal for the Day 2 of our workshop was to speculate and brainstorm future designs of tools that support youth data literacies. After our tool exploration and discussions on Day 1, three interesting brainstorming questions emerged across the breakout sections described above:
How can we close the gap between general purpose tools and specific learning goals?
How can we support storytelling using data?
How can we support insights into the messiness of data and hidden decisions
We focused on discussing these questions on Day 2. A total of 29 participants attended and we once again divided into breakout groups based on the three questions above. For each brainstorming question, we considered the key questions in terms of the following three sub-questions: What are some helpful tools or features that can help answer the question? What are some pitfalls? And what new ideas can we come up with?
Caption: Workshop activities generated an abundance of ideas.
How can we close the gap between general purpose tools and specific learning goals?
Click here to see the activities on Miro board for this breakout session.
Often tools designed to solve a range of potential problems. That said, learners attempting to engage in data analysis are frequently faced with extremely specific questions about their analysis and datasets. Where does their data come from? How is it structured? How can it be collected? How do we balance the desire to serve many specific learners’ goals with general tools against the desire to handle specific challenges well?
As one approach, we drew lines between different parts of doing data analysis and frequently required features in different tools. Of course, data analysis is rarely a simple linear process. We also concluded that perhaps not everything needs to happen in one place or with one tool, and that this should be acknowledged and considered during the design process. We also discussed the importance of providing context within more general data analytic tools. We also talked about how learners need to think about the purpose of their analysis before they consider what tool to use and how, ideally, youth would learn to see patterns in data and to understand the significance of the patterns they find. Finally, we agreed that tools that help students understand the limitations of data and the uncertainty inherent in the data are also important.
Challenges and opportunities for telling stories with data
Click here to see the activities on Miro board for this breakout session.
In this section, we discussed challenges and opportunities around supporting students to tell stories with data. We talked about enabling students to recognize and represent the backstory of data. Open questions included: How do we make sure learners are aware of bias? And how can we help people recognize and document the decision of what to include and exclude?
As for telling stories about students’ own experience of working with data, collaboration was also a topic that came up frequently. We agreed that narrative with data is never an individual process. We discussed that future tools should be designed to support critique, iteration, and collaboration among storytellers, audiences, and maybe also between tellers and audiences.
Finally, we talked about future directions. This included taking a crowdsourced, community-driven approach to tell stories with data. We also noted that we had seen a lot of research effort to support storytelling about data in visualization systems or computational notebooks. We agreed that storytelling should not be limited to digital format and speculated that future designs could extend the storytelling process to unplugged, physical activities. For example, we can design to encourage students to create artefacts and monuments as part of the data storytelling process. We also talked about designing to engage people from diverse backgrounds and communities to contribute to and explore data together.
Challenges and opportunities for helping students to understand the messiness of data
Click here to see the activities on Miro board for this breakout session.
In this section, we talked about the tension between the need to make data clean and easy to use for students and the need to let youth understand the messiness of real world data. We shared our own experiences helping students engage with real or realistic data. A common way is to engage students in collaborative data production and have them compare the outcomes of a similar analysis between each other. For instance, students can document their weekly groceries and find that different people record the same items under different names. They can then come up with a plan to name things consistently and clean their data.
One very interesting point that came up from our discussion was what we really mean by “messy data.” “Messy,” incomplete, or inconsistent data may be unusable for computers while still comprehensible by humans. Therefore to be able to work with messy data does not only mean to have the skills to preprocess, but also involve the recognition of hidden human decisions and assumptions.
We came up with many ideas regarding future system design. We suggested designing to support crowdsourced data storytelling. For example, students can each contribute a small piece of documentation about the background of a dataset. Features might also be designed to support students to collect and represent the backstory of data in innovative ways. For example, functions that support the generation of rich media, such as videos, drawings, journal entries, can be embedded into data representation systems. We might also innovate on the way we design the interface of data storage so that students can interact with rich background information and metadata while still keeping the data “clean” for computation.
Next steps & community
We intend for this workshop to be only the beginning of our learning and exploration in the space of youth data literacies. We also hope to continue building the community we built. In particular, we have started a mailing list where we can continue our ongoing discussion. Please feel free to add yourself to the mailing list if you would like to be kept informed about our ongoing activities.
Although the workshop has ended, we have included links to many resources on the workshop website, and we invite you to explore the site. We also encourage you to contribute to a crowdsourced list of papers on data literacies by filling out this form.
This blog was collaboratively written by Regina Cheng, Stefania Druga, Emilia Gan, and Benjamin Mako Hill.
Stefania Druga is a PhD candidate in the Information School at University of Washington. Her research centers on AI literacy for families and designing tools for interest-based creative coding. In her most recent project, she focuses on building a platform that leverages youth creative confidence via coding with AI agents.
Regina Cheng is a PhD candidate in the Human Centered Design and Engineering department at University of Washington. Her research centers on broadening and facilitating participation in online informal learning communities. In her most recent work, she focuses on designing for novices’ engagement with data in online communities.
Emilia Gan is a graduate student in the Paul G. Allen School of Computer Science and Engineering (UW-Seattle). Her research explores factors that lead to continued participation of novices in computing.
Benjamin Mako Hill is an Assistant Professor at UW. His research involves democratizing data science—and doing it from time to time as well.
This article is a reposted article from Doug Parry’s article in the UW iSchool News Website. The project is being driven by Stefania Druga who is part of the Community Data Science learning team and Mako. Jason Yip is a group friend.
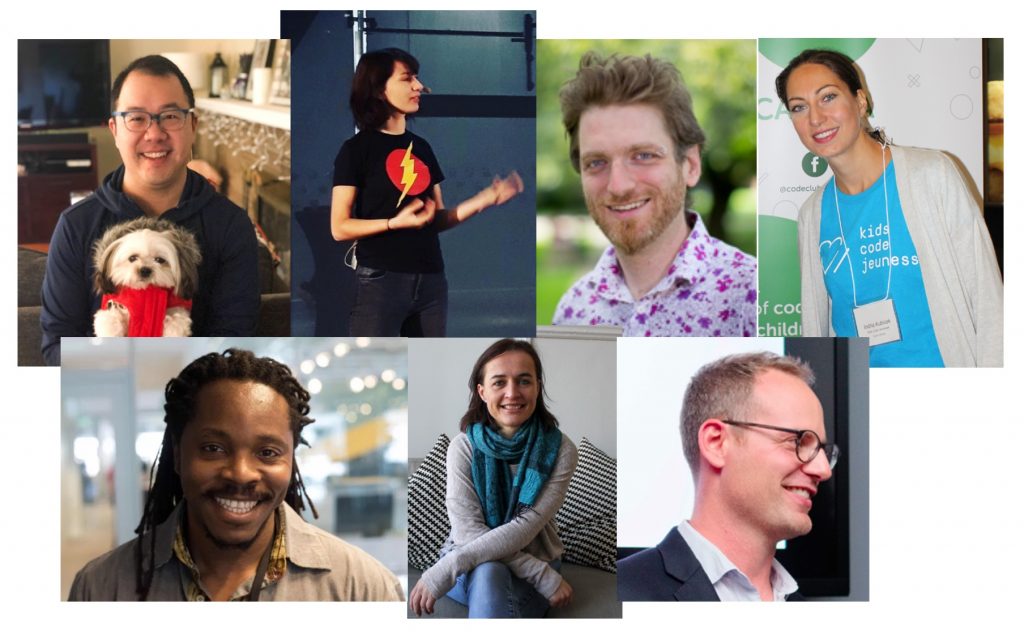
Partners in the AI Literacy Project funded by Jacobs Fellowship (from top left to right): Jason Yip – Assistant Professor iSchool University of Washington, Stefania Druga – Doctoral Student iSchool University of Washington, Benjamin Mako Hill – Assistant Professor Department of Communications University of Washington, Indra Kubicek – CFO at Kids Code Jeunesse, David Moinina Sengeh – Minister Of Basic and Senior Secondary Education at Government of Sierra Leone, Kate Arthur – Founder & CEO at Kids Code Jeunesse, Michael Preston – co-founder CSforALL & Executive Director of Joan Ganz Cooney Center at Sesame Workshop.
A decade ago, teaching kids to code might have seemed far-fetched to some, but now coding curriculum is being widely adopted across the country. Recently researchers have turned their eye to the next wave of technology: artificial intelligence. As AI makes a growing impact on our lives, can kids benefit from learning how it works?
A three-year, $150,000 award from the Jacobs Foundation Research Fellowship Program will help answer that question. The fellowship awarded to Jason Yip, an assistant professor at the University of Washington Information School, will allow a team of researchers to investigate ways to educate kids about AI.
Stefania Druga, a first-year Ph.D. student advised by Yip , is among the researchers spearheading the effort. Druga came to the iSchool after earning her master’s at the Massachusetts Institute of Technology, where she launched Cognimates, a platform that teaches children how to train AI models and interact with them.
Druga’s desire to take Cognimates to the next level brought her to the University of Washington Information School and to her advisor, Yip, whose KidsTeam UW works with children to design technology. KidsTeam treats children as equal partners in the design process, ensuring the technology meets their needs — an approach known as co-design.
At MIT, “I realized there was only so far we could go,” Druga said. “In order for us to imagine what the future interfaces of AI learning for kids would look like, we need to have this longer-term relationship and partnership with kids, and co-design with kids, which is something Jason and the team here have done very well.”
Built on the widely used Scratch programming language, Cognimates is an open-source platform that gives kids the tools to teach computers how to recognize images and text and play games. Druga hopes the next iteration will help children truly understand the concepts behind AI — what is the robot “thinking” and who taught it to think that way? Even if they don’t grow up to be programmers or software engineers, the generation of “AI natives” will need to understand how technology works in order to be critical users.
“It matters as a new literacy,” Druga said, “especially for new generations who are growing up with technologies that become so embedded in things we use on a regular basis.”
Over the course of the fellowship, the research team will work with international partners to develop an AI literacy educational platform and curriculum in multiple languages for use in different settings, in both more- and less-developed parts of the world.
For Yip, the project brings the work of his Ph.D. student together with his work with KidsTeam with other recent research he has conducted on how families interact with AI.
“For me, it’s a proud moment when an advisee has a really cool vision that we can build together as a team,” Yip said. “This is a nice intersection of all of us coming together and thinking about what families need to understand artificial intelligence.”
The Jacobs Foundation fellowship program is open to early- and mid-career researchers from all scholarly disciplines around the world whose work contributes to the development and living conditions of children and youth. It’s highly competitive, with 10-15 fellowships chosen from hundreds of submissions each year.
If you are interested to get involved with this project or support in any way you may contact us at cognimates[a]gmail.com.