Replication data release for examining how rules and rule-making across Wikipedias evolve over time

Screenshot of the same rule, Neutral Point of View, on five different language editions. Notably, the pages are different because they exist as connected but ultimately separate pages.

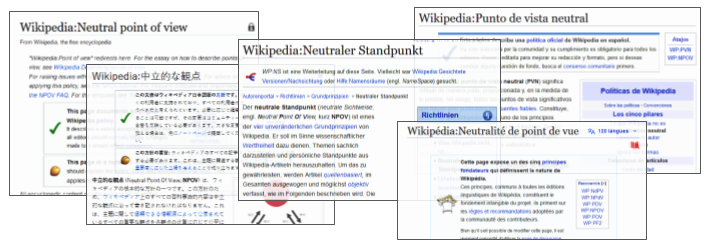
While Wikipedia is famous for its encyclopedic content, it may be surprising to realize that a whole other set of pages on Wikipedia help guide and govern the creation of the peer-produced encyclopedia. These pages extensively describe processes, rules, principles, and technical features of creating, coordinating, and organizing on Wikipedia. Because of the success of Wikipedia, these pages have provided valuable insights into how platforms might decentralize and facilitate participation in online governance. However, each language edition of Wikipedia has a unique set of such pages governing it respectively, even though they are part of the same overarching project: in other words, an under-explored opportunity to understand how governance operates across diverse groups.

In a manuscript published at ICWSM2022, we present descriptive analyses examining on rules and rule-making across language editions of Wikipedia motivated by questions like:

What happens when communities are both relatively autonomous but within a shared system? Given that they’re aligned in key ways, how do their rules and rule-making develop over time? What can patterns in governance work tell us about how communities are converging or diverging over time?

We’ve been very fortunate to share this work with the Wikimedia community since publishing the paper, such as the Wikipedia Signpost and Wikimedia Research Showcase. At the end of last year, we published the replication data and files on Dataverse after addressing a data processing issue we caught earlier in the year (fortunately, it didn’t affect the results – but yet another reminder to quadruple-check one’s data pipeline!). In the spirit of sharing the work more broadly since the Dataverse release, we summarize some of the key aspects of the work here.

Study design

In the project, we examined the five largest language editions of Wikipedia as distinct editing communities: English, German, Spanish, French and Japanese. After manually constructing lists of rules per wiki (resulting in 780 pages), we took advantage of two features on Wikipedia: the revision histories, which log every edit to every page; and the interlanguage links, which connect conceptually equivalent pages across language editions. We then conducted a series of analyses examining comparisons across and relationships between language editions.

Shared patterns across communities

Across communities, we observed that trends suggested that rule-making often became less open over time:

Figure 2 from the ICWSM paper
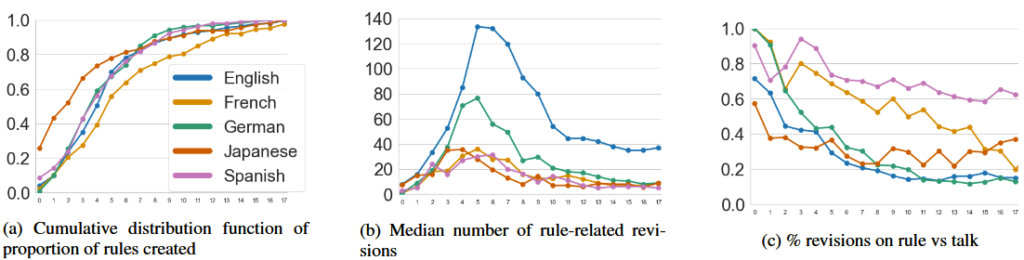
  • Most rules are created early in the life of the language edition community’s life. Over a nearly 20 year period, roughly 50-80% of the rules (depending on the language edition) were created within the first five years!
  • The median edit count to rule pages peaked in early years (between years 3 and 5) before tapering down. The percent of revisions dedicated to editing the actual rule text versus discussing it shifts towards discussion of rule across communities. These both suggest that rules across communities have calcified over time.

Said simply, these communities have very similar trends in rule-making towards formalization.

Divergence vs convergence in rules

Wikipedia’s interlanguage link (ILL) feature, as mentioned above, lets us explore how the rules being created and edited on communities relate to one another. While the trends above highlight similarities in rule-making, here, the picture about how the rule sets are similar or not is a bit more complicated.

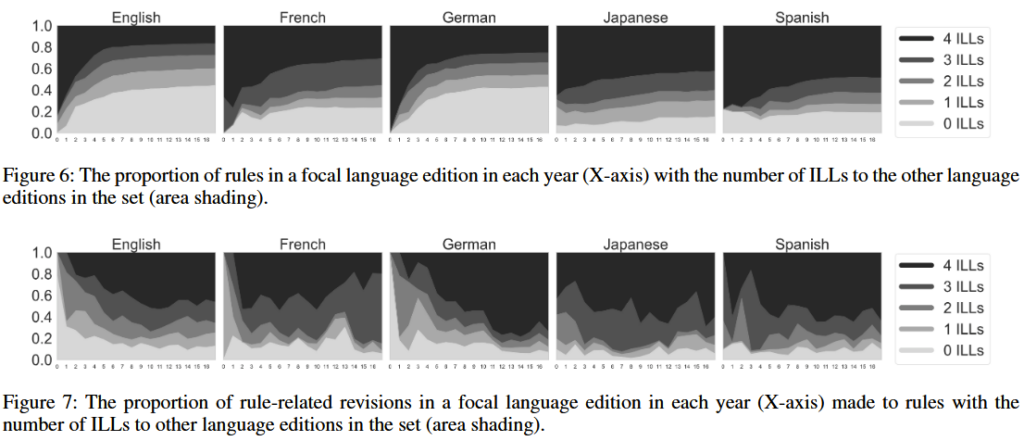
On one hand, the top panel here shows that over time, all five communities see an increase in the proportion of rules in their rules sets that are unique to them individually. On the other hand, the bottom panel shows that editing efforts concentrate on rules that are more shared across communities.

Altogether, we see that communities sharing goals, technology, and a lot more develop substantial and sustained institutional variations; but it’s possible that broad, widely-shared rules created early may help keep them relatively aligned.

Key takeaways

Investigating governance across groups like Wikipedia is valuable for at least two reasons.

First, an enormous amount of effort has gone into studying governance on English Wikipedia, the largest and oldest language edition, to distill lessons about how we can meaningfully decentralize governance in online spaces. But, as prior work [e.g., 1] shows, language editions are often non-aligned in both the content they produce and how they organize that content. Some early stage work we did noted this held true for rule pages on the five language editions of Wikipedia explored here. In recent years, the Wikimedia Foundation itself has made several calls to understand dynamics and patterns beyond English Wikipedia. This work is in part in response to this movement.

Second, the questions explored in our work highlight a key tension in online governance today. While online communities are relatively autonomous entities, they often exist within social and technical systems that put them in relation with one another – whether directly or not. Effectively addressing concerns about online governance means understanding how distinct spaces online govern in ways that are similar or dissimilar, overlap or conflict, diverge and converge. Wikipedia can offer many lessons to this end because it has an especially decentralized and participatory vision of how to govern itself online, such as how patterns of formalization impact success and engagement. Future work we are working on continues in this vein – stay tuned!

Update on the COVID-19 Digital Observatory

A few months ago we announced the launch of a COVID-19 Digital Observatory in collaboration with Pushshift and with funding from Protocol Labs. As part of this effort over the last several months, we have aggregated and published public data from multiple online communities and platforms. We’ve also been hard at work adding a series of new data sources that we plan to release in the near future.

Transmission electron microscope image of SARS-CoV-2—also known as 2019-nCoV, the not-so-novel-anymore virus that causes COVID-19 (Source: NIH NIAID via Wikimedia Commons, cc-sa 2.0)

More specifically, we have been gathering Search Engine Response Page (SERP) data on a range of COVID-19 related terms on a daily basis. This SERP data is drawn from both Bing and Google and has grown to encompass nearly 300GB of compressed data from four months of daily search engine results, with both PC and mobile results from nearly 500 different queries each day.

We have also continued to gather and publish revision and pageview data for COVID-related pages on English Wikipedia which now includes approximately 22GB of highly compressed data (several dozen gigabytes of compressed revision data each day) from nearly 1,800 different articles—a list that has been growing over time.

In addition, we are preparing releases of COVID-related data from Reddit and Twitter. We are almost done with two datasets from Reddit: a first one that includes all posts and comments from COVID-related subreddits, and a second that includes all posts or comments which include any of a set of COVID-related terms.

For the Twitter data, we are working out details of what exactly we will be able to release, but we anticipate including Tweet IDs and metadata for tweets that include COVID-related terms as well as those associated with hashtags and terms we’ve identified in some of the other data collection. We’re also designing a set of random samples of COVID-related Twitter content that will be useful for a range of projects.

In conjunction with these dataset releases, we have published all of the code to create the datasets as well as a few example scripts to help people learn how to load and access the data we’ve collected. We aim to extend these example analysis scripts in the future as more of the data comes online.

We hope you will take a look at the material we have been releasing and find ways to use it, extend it, or suggest improvements! We are always looking for feedback, input, and help. If you have a COVID-related dataset that you’d like us to publish, or if you would like to write code or documentation, please get in touch!

All of the data, code, and other resources are linked from the project homepage. To receive further updates on the digital observatory, you can also subscribe to our low traffic announcement mailing list.

Launching the COVID-19 Digital Observatory

The Community Data Science Collective, in collaboration with Pushshift and others, is launching a new collaborative project to create a digital observatory for socially produced COVID-19 information. The observatory has already begun the process of collecting, and aggregating public data from multiple online communities and platforms. We are publishing reworked versions of these data in forms that are well-documented and more easily analyzable by researchers with a range of skills and computation resources. We hope that these data will facilitate analysis and interventions to improve the quality of socially produced information and public health.

Transmission electron microscope image of SARS-CoV-2—also known as 2019-nCoV, the virus that causes COVID-19 (Source: NIH NIAID via Wikimedia Commons, cc-sa 2.0).

During crises such as the current COVID-19 pandemic, many people turn to the Internet for information, guidance, and help. Much of what they find is socially produced through online forums, social media, and knowledge bases like Wikipedia. The quality of information in these data sources varies enormously and users of these systems may receive information that is incomplete, misleading, or even dangerous. Efforts to improve this are complicated by difficulties in discovering where people are getting information and in coordinating efforts to focus on refining the more important information sources. There are number of researchers with the skills and knowledge to address these issues, but who may struggle to gather or process social data. The digital observatory facilitates data collection, access, and analysis.

Our initial release includes several datasets, code used to collect the data, and some simple analysis examples. Details are provided on the project page as well as our public Github repository. We will continue adding data, code, analysis, documentation, and more. We also welcome collaborators, pull-requests, and other contributions to the project.

What’s the goal for this project?

Our hope is that the public datasets and freely licensed tools, techniques, and knowledge created through the digital observatory will allow researchers, practitioners, and public health officials to more efficiently gather, analyze, understand, and act to improve these crucial sources of information during crises. Ultimately this will support ongoing responses to COVID-19 and contribute to future preparedness to respond to crisis events through analyses conducted after the fact.

How do I get access to the digital observatory?

The digital observatory data, code, and other resources will exist in a few locations, all linked from the project homepage. The data we collect, parse, and publish lives at covid19.communitydata.org/datasets. The code to collect, parse, and output those datasets lives in our Github repository, which also includes some scripts for getting started with analysis. We will integrate additional data and data collection resources from Pushshift and adjacent projects as we go. For more information, please check out the project page.

Stay up to date!

To receive updates on the digital observatory, please subscribe to our low traffic announcement mailing list. You will be the first to know about new datasets and other resources (and we won’t use or distribute addresses for any other reason).

Introducing Computational Methods to Social Media Scientists

The ubiquity of large-scale data and improvements in computational hardware and algorithms have provided enabled researchers to apply computational approaches to the study of human behavior. One of the richest contexts for this kind of work is social media datasets like Facebook, Twitter, and Reddit.

We were invited by Jean BurgessAlice Marwick, and Thomas Poell to write a chapter about computational methods for the Sage Handbook of Social Media. Rather than simply listing what sorts of computational research has been done with social media data, we decided to use the chapter to both introduce a few computational methods and to use those methods in order to analyze the field of social media research.

A “hairball” diagram from the chapter illustrating how research on social media clusters into distinct citation network neighborhoods.

Explanations and Examples

In the chapter, we start by describing the process of obtaining data from web APIs and use as a case study our process for obtaining bibliographic data about social media publications from Elsevier’s Scopus API.  We follow this same strategy in discussing social network analysis, topic modeling, and prediction. For each, we discuss some of the benefits and drawbacks of the approach and then provide an example analysis using the bibliographic data.

We think that our analyses provide some interesting insight into the emerging field of social media research. For example, we found that social network analysis and computer science drove much of the early research, while recently consumer analysis and health research have become more prominent.

More importantly though, we hope that the chapter provides an accessible introduction to computational social science and encourages more social scientists to incorporate computational methods in their work, either by gaining computational skills themselves or by partnering with more technical colleagues. While there are dangers and downsides (some of which we discuss in the chapter), we see the use of computational tools as one of the most important and exciting developments in the social sciences.

Steal this paper!

One of the great benefits of computational methods is their transparency and their reproducibility. The entire process—from data collection to data processing to data analysis—can often be made accessible to others. This has both scientific benefits and pedagogical benefits.

To aid in the training of new computational social scientists, and as an example of the benefits of transparency, we worked to make our chapter pedagogically reproducible. We have created a permanent website for the chapter at https://communitydata.science/social-media-chapter/ and uploaded all the code, data, and material we used to produce the paper itself to an archive in the Harvard Dataverse.

Through our website, you can download all of the raw data that we used to create the paper, together with code and instructions for how to obtain, clean, process, and analyze the data. Our website walks through what we have found to be an efficient and useful workflow for doing computational research on large datasets. This workflow even includes the paper itself, which is written using LaTeX + knitr. These tools let changes to data or code propagate through the entire workflow and be reflected automatically in the paper itself.

If you  use our chapter for teaching about computational methods—or if you find bugs or errors in our work—please let us know! We want this chapter to be a useful resource, will happily consider any changes, and have even created a git repository to help with managing these changes!

The Community Data Science Collective Dataverse

I’m pleased to announce the Community Data Science Collective Dataverse. Our dataverse is an archival repository for datasets created by the Community Data Science Collective. The dataverse won’t replace work that collective members have been doing for years to document and distribute data from our research. What we hope it will do is get our data — like our published manuscripts — into the hands of folks in the “forever” business.

Over the past few years, the Community Data Science Collective has published several papers where an important part of the contribution is a dataset. These include:

Recently, we’ve also begun producing replication datasets to go alongside our empirical papers. So far, this includes:

In the case of each of the first groups of papers where the dataset was a part of the contribution, we uploaded code and data to a website we’ve created. Of course, even if we do a wonderful job of keeping these websites maintained over time, eventually, our research group will cease to exist. When that happens, the data will eventually disappear as well.

The text of our papers will be maintained long after we’re gone in the journal or conference proceedings’ publisher’s archival storage and in our universities’ institutional archives. But what about the data? Since the data is a core part — perhaps the core part — of the contribution of these papers, the data should be archived permanently as well.

Toward that end, our group has created a dataverse. Our dataverse is a repository within the Harvard Dataverse where we have been uploading archival copies of datasets over the last six months. All five of the papers described above are uploaded already. The Scratch dataset, due to access control restrictions, isn’t listed on the main page but it’s online on the site. Moving forward, we’ll be populating this new datasets we create as well as replication datasets for our future empirical papers. We’re currently preparing several more.

The primary point of the CDSC Dataverse is not to provide you with way to get our data although you’re certainly welcome to use it that way and it might help make some of it more discoverable. The websites we’ve created (like for the ones for redirects and for page protection) will continue to exist and be maintained. The Dataverse is insurance for if, and when, those websites go down to ensure that our data will still be accessible.


This post was also published on Benjamin Mako Hill’s blog Copyrighteous.

New Dataset: Five Years of Longitudinal Data from Scratch

Scratch is a block-based programming language created by the Lifelong Kindergarten Group (LLK) at the MIT Media Lab. Scratch gives kids the power to use programming to create their own interactive animations and computer games. Since 2007, the online community that allows Scratch programmers to share, remix, and socialize around their projects has drawn more than 16 million users who have shared nearly 20 million projects and more than 100 million comments. It is one of the most popular ways for kids to learn programming and among the larger online communities for kids in general.

Front page of the Scratch online community (https://scratch.mit.edu) during the period covered by the dataset.

Since 2010, I have published a series of papers using quantitative data collected from the database behind the Scratch online community. As the source of data for many of my first quantitative and data scientific papers, it’s not a major exaggeration to say that I have built my academic career on the dataset.

I was able to do this work because I happened to be doing my masters in a research group that shared a physical space (“The Cube”) with LLK and because I was friends with Andrés Monroy-Hernández, who started in my masters cohort at the Media Lab. A year or so after we met, Andrés conceived of the Scratch online community and created the first version for his masters thesis project. Because I was at MIT and because I knew the right people, I was able to get added to the IRB protocols and jump through the hoops necessary to get access to the database.

Over the years, Andrés and I have heard over and over, in conversation and in reviews of our papers, that we were privileged to have access to such a rich dataset. More than three years ago, Andrés and I began trying to figure out how we might broaden this access. Andrés had the idea of taking advantage of the launch of Scratch 2.0 in 2013 to focus on trying to release the first five years of Scratch 1.x online community data (March 2007 through March 2012) — most of the period that the codebase he had written ran the site.

After more work than I have put into any single research paper or project, Andrés and I have published a data descriptor in Nature’s new journal Scientific Data. This means that the data is now accessible to other researchers. The data includes five years of detailed longitudinal data organized in 32 tables with information drawn from more than 1 million Scratch users, nearly 2 million Scratch projects, more than 10 million comments, more than 30 million visits to Scratch projects, and much more. The dataset includes metadata on user behavior as well the full source code for every project. Alongside the data is the source code for all of the software that ran the website and that users used to create the projects as well as the code used to produce the dataset we’ve released.

Releasing the dataset was a complicated process. First, we had navigate important ethical concerns about the the impact that a release of any data might have on Scratch’s users. Toward that end, we worked closely with the Scratch team and the the ethics board at MIT to design a protocol for the release that balanced these risks with the benefit of a release. The most important features of our approach in this regard is that the dataset we’re releasing is limited to only public data. Although the data is public, we understand that computational access to data is different in important ways to access via a browser or API. As a result, we’re requiring anybody interested in the data to tell us who they are and agree to a detailed usage agreement. The Scratch team will vet these applicants. Although we’re worried that this creates a barrier to access, we think this approach strikes a reasonable balance.

Beyond the the social and ethical issues, creating the dataset was an enormous task. Andrés and I spent Sunday afternoons over much of the last three years going column-by-column through the MySQL database that ran Scratch. We looked through the source code and the version control system to figure out how the data was created. We spent an enormous amount of time trying to figure out which columns and rows were public. Most of our work went into creating detailed codebooks and documentation that we hope makes the process of using this data much easier for others (the data descriptor is just a brief overview of what’s available). Serializing some of the larger tables took days of computer time.

In this process, we had a huge amount of help from many others including an enormous amount of time and support from Mitch Resnick, Natalie Rusk, Sayamindu Dasgupta, and Benjamin Berg at MIT as well as from many other on the Scratch Team. We also had an enormous amount of feedback from a group of a couple dozen researchers who tested the release as well as others who helped us work through through the technical, social, and ethical challenges. The National Science Foundation funded both my work on the project and the creation of Scratch itself.

Because access to data has been limited, there has been less research on Scratch than the importance of the system warrants. We hope our work will change this. We can imagine studies using the dataset by scholars in communication, computer science, education, sociology, network science, and beyond. We’re hoping that by opening up this dataset to others, scholars with different interests, different questions, and in different fields can benefit in the way that Andrés and I have. I suspect that there are other careers waiting to be made with this dataset and I’m excited by the prospect of watching those careers develop.

You can find out more about the dataset, and how to apply for access, by reading the data descriptor on Nature’s website.

The paper and work this post describes is collaborative work with Andrés Monroy-Hernández. The paper is released as open access so anyone can read the entire paper here. This blog post was also posted on Benjamin Mako Hill’s blog.