Women in Data Science Puget Sound is part of a 50+-country conference series founded and organized in cooperation with Stanford University’s Data Science coalition. Anyone may attend, regardless of gender: events feature a speaker lineup composed of women in data science. The Puget Sound event is Tuesday, April 25 at the Expedia HQ in Seattle, and numerous affiliated regional and online events are scheduled in the coming weeks.
If you’re in the Seattle area, you might like to catch CDSC member Kaylea presenting a workshop! Here’s the pitch for attending her beginner-friendly session:
Let’s Re-think Political Bias & Build Our Own Classifier
How can we think about political bias without falling into assumptions about who's on what side and what that means?
Data science and ML offer us an alternative: we can parse political speech about a topic and use NLP/ML techniques to classify articles we scrape from the web.
In this hands-on workshop, we'll parse the Congressional Record, build a classifier, scrape search results, and analyze texts. You'll walk away with your own example of how to use data science to analyze political framing.
The full lineup of speakers for the Puget Sound conference is posted here. Tickets for the single-day event are $80 (see this link to request a discount code for half off).
Topics on the schedule for this event look juicy if quant work is your jam: AI, BERT, hypergraphs, visualization, forecasting, quantum computing, causal inference, survival analysis, writing better code and career management, with examples ranging from search, sales, and supply chain to economic disparity, DNA sequencing and saving wildlife!
In The Modem World, Driscoll provides an engaging social history of Bulletin Board Systems (BBSes), an early, dial-up precursor to social media that predated the World Wide Web. You might have heard of the most famous BBSes—likely Stuart Brand’s Whole Earth ‘Lectronic Link, or the WELL—but, as Driscoll elaborates, there were many others. Indeed, thousands of decentralized, autonomous virtual communities thrived around the world in the decades before the Internet became accessible to the general public. Through Driscoll’s eyes, these communities offer a glimpse of a bygone sociotechnical era and that prefigured and shaped our own in numerous ways. The “modem world” also suggests some paths beyond our current moment of disenchantment with the venture-funded, surveillance capitalist, billionaire-backed platforms that dominate social media today.
The book, like everything of Driscoll’s that I’ve ever read, is both enjoyable and informative and I recommend it for a number of reasons. I also (more selfishly) recommend the book review, which was fun to write and is just a few pages long. I got helpful feedback along the way from Yibin Fan, Kaylea Champion, and Hannah Cutts.
Because IJOC is an open access journal that publishes under a CC-BY-NC-ND license, you can read the review without paywalls, proxies, piracy, etc. Please feel free to send along any comments or feedback! For example, at least one person (who I won’t name here) thinks I should have emphasized the importance of porn in Driscoll’s account more heavily! While porn was definitely an important part of the BBS universe, I didn’t think it was such a central component of The Modem World. Ymmv?
A new paper that our that our group has published seeks to test whether the kind of communication patterns associated with successful offline teams also predict success in online collaborative settings. Surprisingly, we find that it does not. In the rest of this blog post, we summarize that research and unpack that result.
Many of us have been part of a work team where everyone clicked. Everyone liked and respected each other, maybe you even hung out together outside of work. In a team like that, when someone asks you to cover a shift, or asks you to stay late to help them finish a project, you do it.
This anecdotal experience that many of us have is borne out by research. When members of work groups in corporate settings feel integrated into a group, and particularly when their identity is connected to their group membership, they are more willing to contribute to the group’s goals. Integrative groups (where there isn’t a strong hierarchy and where very few people are on the periphery) are also able to communicate and coordinate their work better.
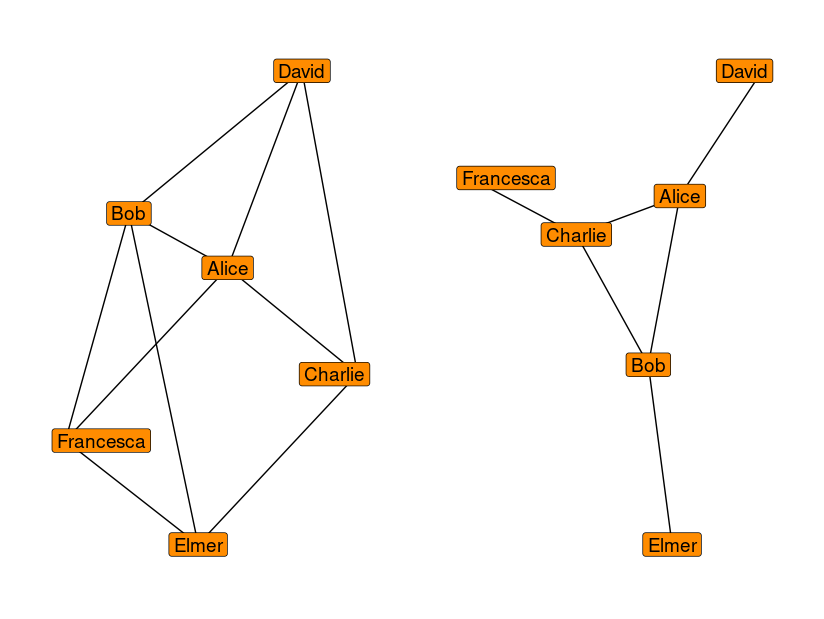
One way to measure whether a group is “integrative” is to look at the group’s conversation networks, as shown in the figure below. Groups where few people are on the periphery (like on the left) usually perform better along a number of dimensions, such as creativity and productivity.
Examples of two possible configurations of a work group. The work group on the left is much more “integrative,” and we would expect it to be more creative and productive.
In our new paper, we set out to look for evidence that early online wiki communities at Fandom.com work the same way as work groups. When communities are getting started, there are lots of reasons to think that they would also benefit from integrative networks. Their members typically don’t know each other and communicate mostly via text—conditions that should make building a shared identity tough. In addition, they are volunteers who can easily leave at any time. The research on work groups made us think that integrative social structures would be especially important in making new wikis successful.
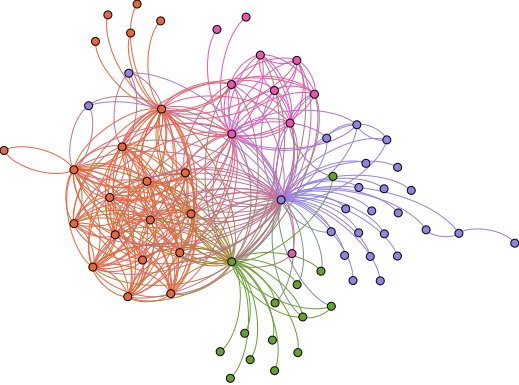
Communication network of the Spongebob wiki after 700 edits
In order to measure the social structure of these communities, we created communication networks for almost 1,000 wikis for the talk that happened during their firs 700 main page edits. Connections between people were based on who talked to whom on Talk pages. These are wiki pages connected to each page and each registered user on a wiki. We connected users who talked to each other at least a few times on the same talk pages, and looked at whether how integrative a communication network was predicted 1) how much people contributed and 2) how long a wiki remained active.
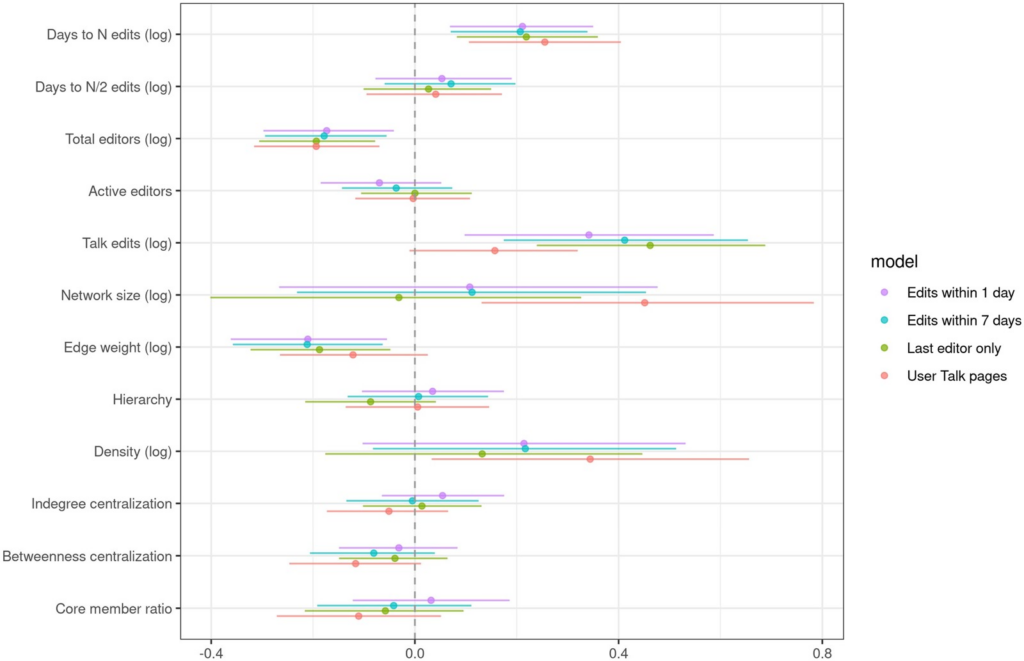
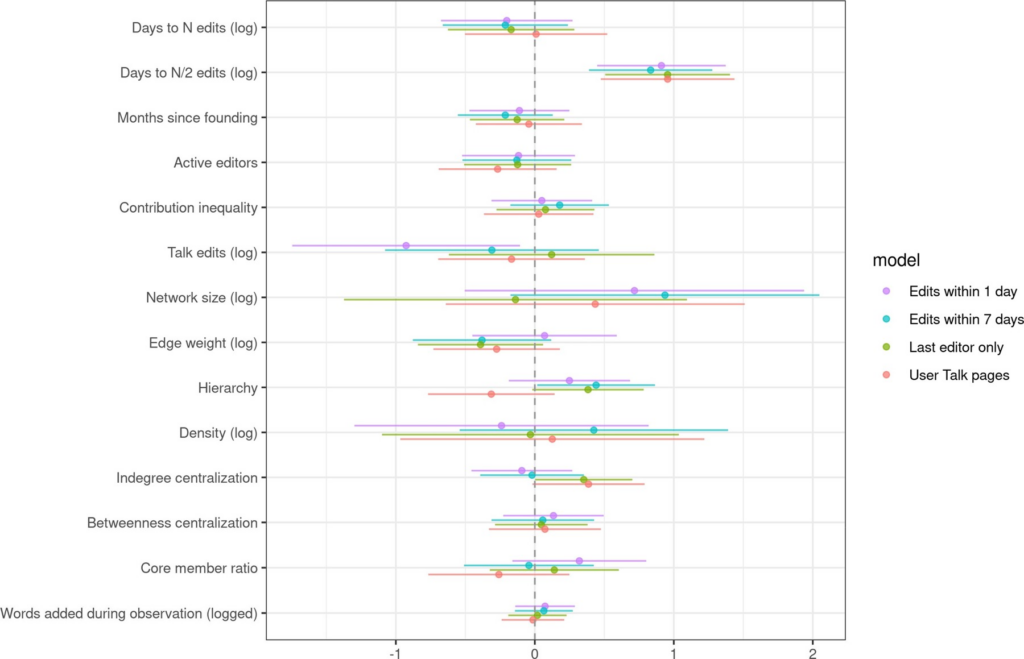
Surprisingly, we found that no matter how we measured communication networks, and no matter how we measured success, integrative network measures were not good at predicting that a wiki would survive or be productive. While a few of our control variables helped to predict productivity and survival, none of the network measures (nor all of them taken together) helped much to predict either of our success measures, as shown in Figures 5 and 6 from the paper.
Figure 5. Estimated coefficients predicting the productivity of a wiki.Figure 6. Estimated coefficients predicting how quickly a wiki will become inactive.
So, what is going on here?
We have a few possible explanations for why communication network structures don’t seem to matter. One is that group identity for wiki members may not be influenced much by network structure. In a work group, it can be painfully obvious if you are on the periphery and not included in conversations or activities. Even though wiki conversations are technically all public and visible, in practice it’s very easy for group members to be unaware of conversations happening in other parts of the site. This idea is supported by research led by Sohyeon Hwang, which showed that people can build identity in an online community even without personal relationships.
Another complementary explanation for how groups coordinate work without integrative communication networks is that wiki software helps to organize what needs to be done without explicit communication. Much of this happens just because the central artifact of the community—the wiki—is continuously updated, so it is (relatively) clear what has been done and what needs to be done. In addition, there are opportunities for stigmergy. Stigmergy occurs when actors modifying the environment as a way of communicating. Then, others make decisions based on observing the environment. The canonical example is ants who leave pheremone trails for other ants to find and follow.
In wikis, this can be accomplished in a few ways. For example, contributors can create a link to a page that doesn’t yet exist. By default, these show up as red links, suggesting to others that a page needs to be created.
A final possible explanation for our results is based on how easy it is to join and leave online communities. It may be that integrative structures are so important because they help groups to overcome and navigate conflicts; in online communities contributors may be more likely to simply disengage instead of trying to resolve a conflict.
As we conclude in the paper:
Why do communication networks—important predictors of group performance outcomes across diverse domains—not predict productivity or survival in peer production? Our findings suggest that the relationship of communication structure to effective collaboration and organization is not universal but contingent. While all groups require coordination and undergo social influence, groups composed of different types of people or working in different technological contexts may have different communicative needs. Wikis provide a context where coordination via stigmergy may suffice and where the role of cheap exit as well as the difficulty of group-level conversation may lead to consensus-by-attrition.
We hope that others will help us to study some of these mechanisms more directly, and look forward to talking more with researchers and others interested in how and why online groups succeed.
The full citation for the paper is: Foote, Jeremy, Aaron Shaw, and Benjamin Mako Hill. 2023. “Communication Networks Do Not Predict Success in Attempts at Peer Production.” Journal of Computer-Mediated Communication 28 (3): zmad002. https://doi.org/10.1093/jcmc/zmad002.
Many online platforms are adopting machine learning as a tool to maintain order and high quality information in the face of massive influxes of of user generated content. Of course, machine learning algorithms can be inaccurate, biased or unfair. How do signals from machine learning predictions shape the fairness of online content moderation? How can we measure an algorithmic flagging system’s effects?
In our paper published at CSCW 2021, I (Nate TeBlunthuis) together with Benjamin Mako Hill and Aaron Halfaker analyzed the RCFilters system: an add-on to Wikipedia that highlights and filters edits that a machine learning algorithm called ORES identifies as likely to be damaging to Wikipedia. This system has been deployed on large Wikipedia language editions and is similar to other algorithmic flagging systems that are becoming increasingly widespread. Our work measures the causal effect of being flagged in the RCFilters user interface.
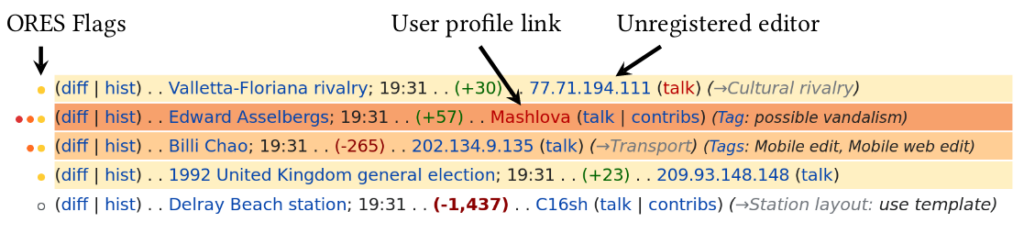
Screenshot of Wikipedia edit metadata on Special:RecentChanges with RCFilters enabled. Highlighted edits with a colored circle to the left side of other metadata are flagged by ORES. Different circle and highlight colors (white, yellow, orange, and red in the figure) correspond to different levels of confidence that the edit is damaging. RCFilters does not specifically flag edits by new accounts or unregistered editors, but does support filtering changes by editor types.
Our work takes advantage of the fact that RCFilters, like many algorithmic flagging systems, create discontinuities in the relationship between the probability that a moderator should take action and whether a moderator actually does. This happens because the output of machine learning systems like ORES is typically a continuous score (in RCFilters, an estimated probability that a Wikipedia edit is damaging), while the flags (in RCFilters, the yellow, orange, or red highlights) are either on or off and are triggered when the score crosses some arbitrary threshold. As a result, edits slightly above the threshold are both more visible to moderators and appear more likely to be damaging than edits slightly below. Even though edits on either side of the threshold have virtually the same likelihood of truly being damaging, the flagged edits are substantially more likely to be reverted. This fact lets us use a method called regression discontinuity to make causal estimates of the effect of being flagged in RCFilters.
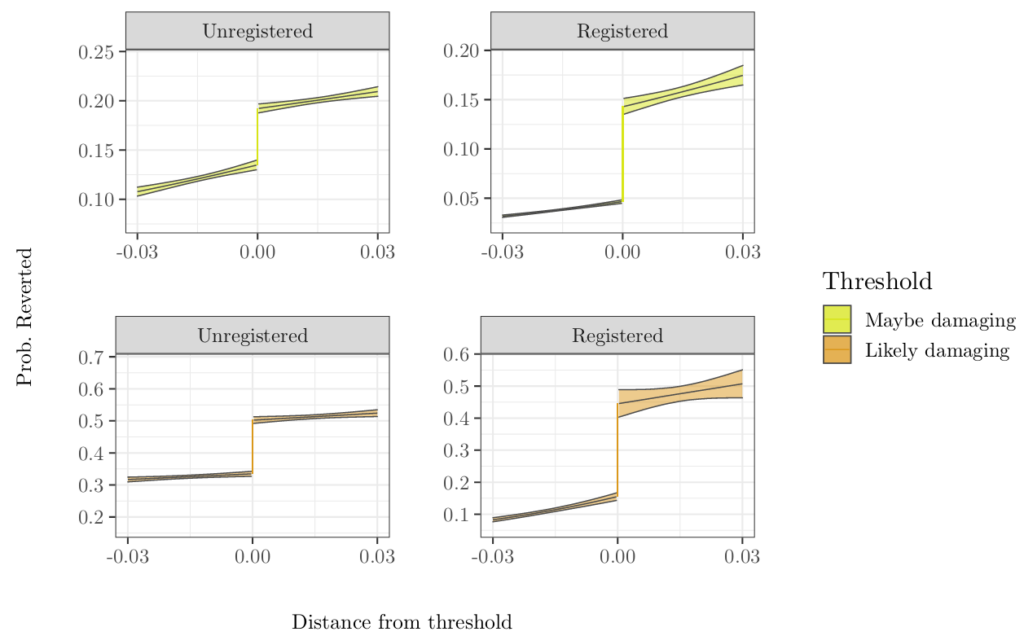
Charts showing the probability that an edit will be reverted as function of ORES scores in the neighborhood of the discontinuous threshold that triggers the RCfilters flag. The jump in the increase in reversion chances is larger for registered editors compared to unregistered editors at both thresholds.
To understand how this system may effect the fairness of Wikipedia moderation, we estimate the effects of flagging on edits on different groups of editors. Comparing the magnitude of these estimates lets us measure how flagging is associated with several different definitions of fairness. Surprisingly, we found evidence that these flags improved fairness for categories of editors that have been widely perceived as troublesome—particularly unregistered (anonymous) editors. This occurred because flagging has a much stronger effect on edits by the registered than on edits by the unregistered.
We believe that our results are driven by the fact algorithmic flags are especially helpful for finding damage that can’t be easily detected otherwise. Wikipedia moderators can see the editor’s registration status in the recent changes, watchlists, and edit history. Because unregistered editors are often troublesome, Wikipedia moderators’ attention is often focused on their contributions, with or without algorithmic flags. Algorithmic flags make damage by registered editors (in addition to unregistered editors) much more detectable to moderators and so help moderators focus on damage overall, not just damage by suspicious editors. As a result, the algorithmic flagging system decreases the bias that moderators have against unregistered editors.
This finding is particularly surprising because the ORES algorithm we analyzed was itself demonstrably biased againstunregistered editors (i.e., the algorithm tended to greatly overestimate the probability that edits by these editors were damaging). Despite the fact that the algorithms were biased, their introduction could still lead to less biased outcomes overall.
Our work shows that although it is important to design predictive algorithms to not have such biases, it is equally important to study fairness at the level of the broader sociotechnical system. Since we first published a preprint of our paper, a followup piece by Leijie Wang and Haiyi Zhu replicated much of our work and showed that differences between different Wikipedia communities may be another important factor driving the effect of the system. Overall, this work suggests that social signals and social context can interact with algorithmic signals and together these can influence behavior in important and unexpected ways.
The full citation for the paper is: TeBlunthuis, Nathan, Benjamin Mako Hill, and Aaron Halfaker. 2021. “Effects of Algorithmic Flagging on Fairness: Quasi-Experimental Evidence from Wikipedia.” Proceedings of the ACM on Human-Computer Interaction 5 (CSCW): 56:1-56:27. https://doi.org/10.1145/3449130.
We have also released replication materials for the paper, including all the data and code used to conduct the analysis and compile the paper itself.
Our fourth Community Dialogue covered topics on accountable governance and data leverage as a tool for accountable governance. It featured Amy X. Zhang (University of Washington) and recent CDSC graduate Nick Vincent (Northwestern, UC Davis).
Designing and Building Governance in Online Communities (Amy X. Zhang)
This session discussed different methods of engagement between communities and their governance structures, different models of governance, and empirical work to understand tensions within communities and governance structures. Amy presented PolicyKit, a tool her team built in response to what they learned from their research, which will also help to continue to better understand governance.
Can We Solve Emerging Problems in Technology and AI By Giving Communities Data Leverage? (Nick Vincent)
Nick Vincent looked at the question of how to hold governance structures accountable through collective action. He asked how groups can leverage control of data and the potential implications of data leverage on social structures and technical development.
Inequality and discrimination in the labor market is a persistent and sometimes devastating problem for job seekers. Increasingly, labor is moving to online platforms, but labor inequality and discrimination research often overlooks work that happens on such platforms. Do research findings from traditional labor contexts generalize to the online realm? We have reason to think perhaps not, since entering the online labor market requires specific technical infrastructure and skills (as we showed in this paper). Besides, hiring processes for online platforms look significantly different: these systems use computational structures to organize labor at a scale that exceeds any hiring operation in the traditional labor market.
To understand what research on patterns of inequality and discrimination in the gig economy is out there and to identify remaining puzzles, I (Floor) systematically gathered, analyzed, and synthesized studies on this topic. The result is a paper recently published in New Media & Society.
I took a systematic approach in order to capture all the different strands of inquiry across various academic fields. These different strands might use different methods and even different language but, crucially, still describe similar phenomena. For this review, Siying Luo (research assistant on this project) and I gathered literature from five academic databases covering multiple disciplines. By sifting through many journal articles and conference proceedings, we identified 39 studies of participation and success in the online labor market.
Most research focuses on individual-level resources and biases as a source of unequal participation, rather than the role of the platform.
Three approaches
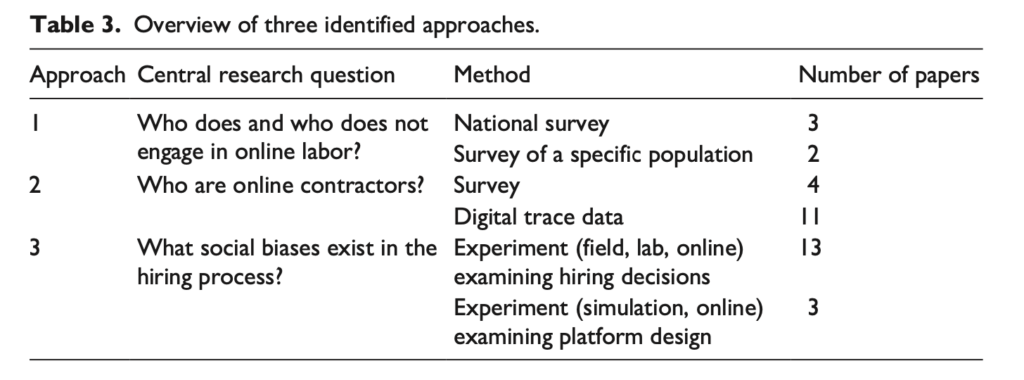
I found three approaches to the study of inequality and discrimination in the gig economy. All address distinct research questions drawing on different methods and framing (see the table below for an overview).
Approach 1 asks who does and who does not engage in online labor. This strand of research takes into account the voices of both those who have pursued such labor and those who have not. Five studies take this approach, of which three draw on national survey data and two others examine participation among a specific population (such as older adults).
Approach 2 asks who online contractors are. Some of this research describes the sociodemographic composition of contractors by surveying them or by analyzing digital trace data. Other studies focus on labor outcomes, identifying who among those that pursue online labor actually land jobs and generate an income. You might imagine a study asking whether male contractors make more money on an online platform than female contractors do.
Approach 3 asks what social biases exist in the hiring process, both on the side of individual users making hiring decisions and the algorithms powering the online labor platforms. Studies taking this approach tend to rely on experiments that test the impact of some manipulation in the contractor’s sociodemographic background on an outcome, such as whether they get featured by the platform or whether they get hired.
Extended pipeline of online participation inequalities
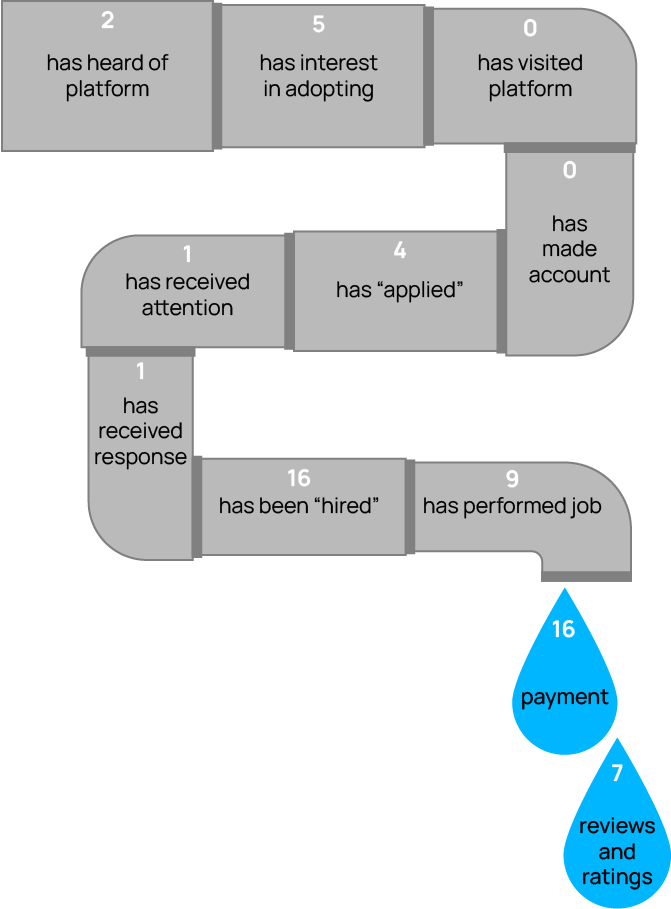
In addition to identifying these three approaches, I map the outcomes variables of all studies across an extended version of the so-called pipeline of participation inequalities (as coined and tested in this paper). This model breaks down the steps one needs to take before being able to contribute online, presenting them in the form of a pipeline. Studying online participation as stages of the pipeline allows for the identification of barriers since it reveals the spots where people face obstacles and drop out before fully participating. Mapping the literature on inequality and discrimination in the gig economy across stages of a pipeline proved helpful in understanding and visualizing what parts of the process of becoming an online contractor have been studied and what parts require more attention.
I extended the pipeline of participation inequalities to fit the process of participating in the gig economy. This form of online participation does not only require having the appropriate access and skills to participate, but also requires garnering attention and getting hired. The extended pipeline model has eleven stages: from having heard of a platform to receiving payment as well as reviews and ratings for having performed a job. The figure below shows a visualization of the pipeline with the number of studies that study an outcome variable associated with each stage.
The extended pipeline of participation inequalities, specific to the process of becoming an online contractor, with the number of studies that examined each stage
When mapping the studies across the pipeline, we find that two stages have been studied much more than others. Prior literature primarily examines whether individuals who pursue work online are getting hired and receiving a payment. In contrast, the literature in this scoping review hardly examined earlier stages of the pipeline.
So, what should we take away?
After systematically gathering and analyzing the literature on inequality and discrimination in the online labor market, I want to highlight three takeaways.
One: Most of the research focuses on individual-level resources and biases as a source of unequal participation. This scoping review points to a need for future research to examine the specific role of the platform in facilitating inequality and discrimination.
Two: The literature thus far has primarily focused on behaviors at the end of the pipeline of participation inequalities (i.e., having been hired and received payment). Studying earlier stages is important as it might explain patterns of success in later stages. In addition, such studies are also worthwhile inquiries in their own right. Insights into who meets these conditions of participation and desired labor outcomes are valuable, for example, in designing policy interventions.
Three: Hardly any research looks at participation across multiple stages of the pipeline. Considering multiple stages in one study is important to identify the moments that individuals face obstacles and how sociodemographic factors relate to making it from one stage to the next.
Floor Fiers is PhD candidate at Northwestern University in the Media, Technology, and Society program. They received support and advice from other members of the collective. Most notably, Siying Luo contributed greatly to this project as a research assistant.
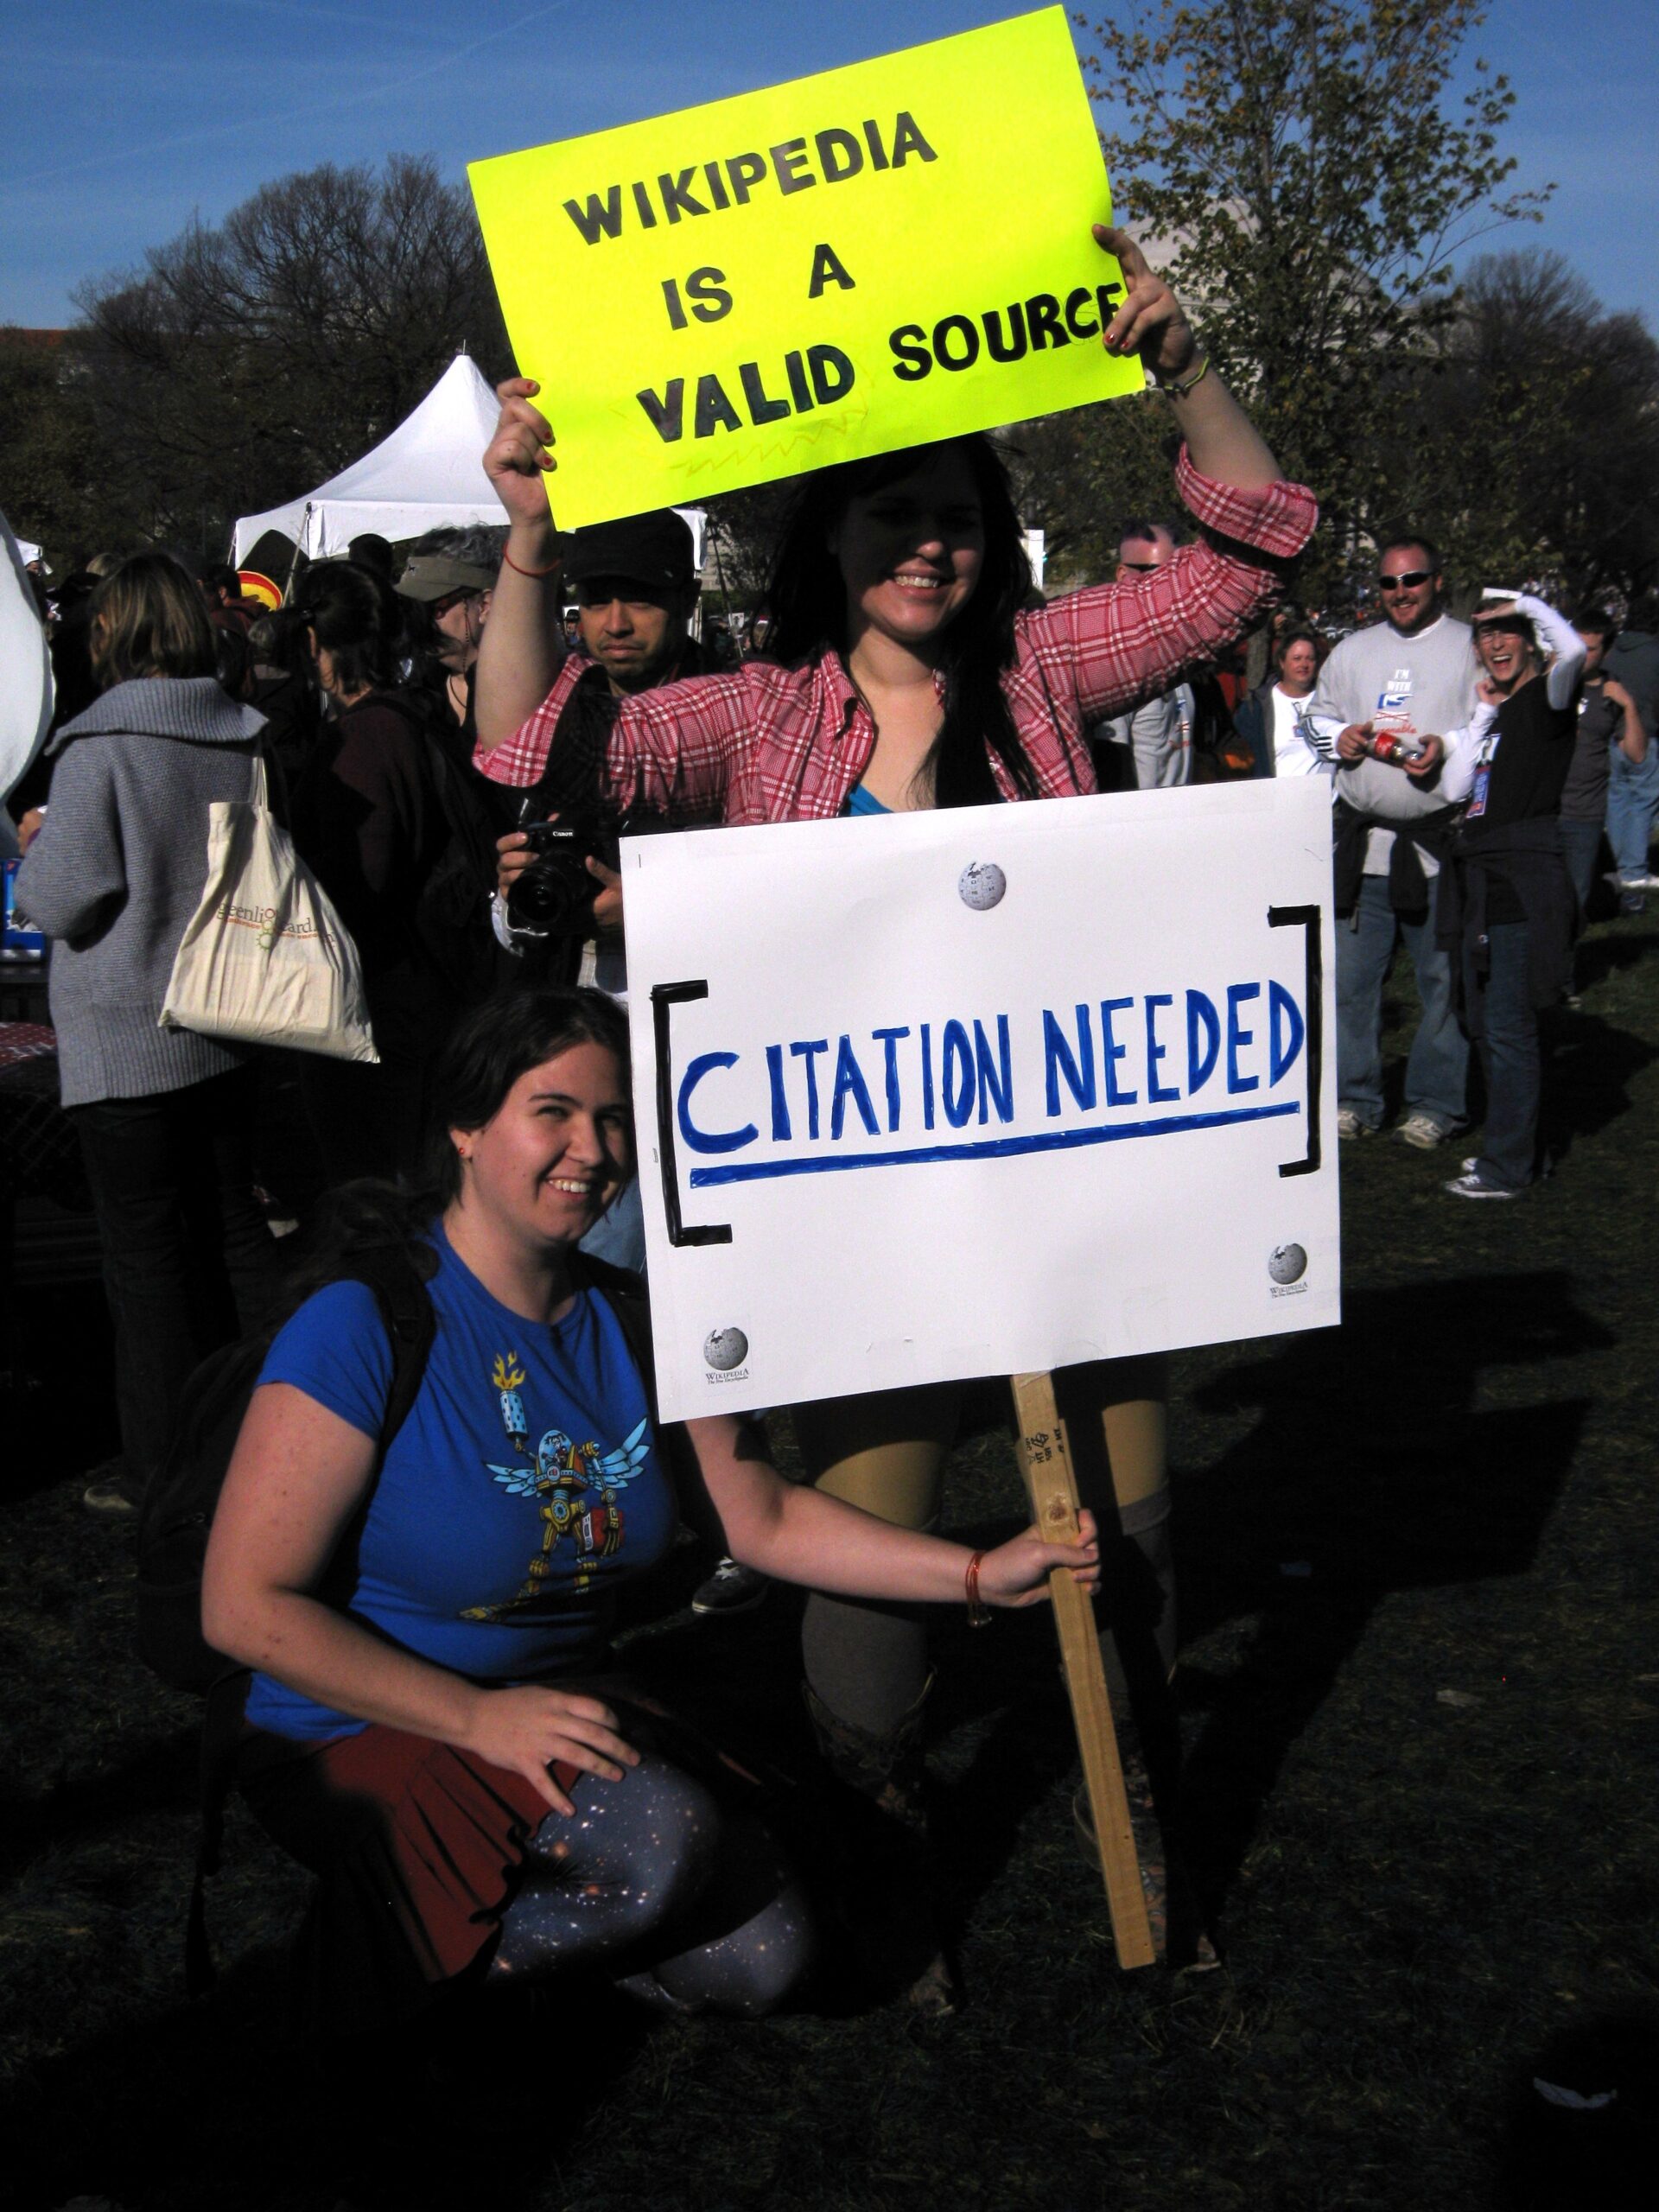
Two participants of the “Rally to Restore Sanity and/or Fear” in Washington D.C. (USA), holding signs saying “Wikipedia is a valid source” and “citation needed.” October 30, 2010. Kat Walsh (User:Mindspillage), CC BY-SA 3.0 https://creativecommons.org/licenses/by-sa/3.0, via Wikimedia Commons
Wikipedia provides the best and most accessible single source of information on the largest number of topics in the largest number of languages. If you’re anything like me, you use it all the time. If you (also like me) use Wikipedia to inform your research, teaching, or other sorts of projects that result in shared, public, or even published work, you may also want to cite Wikipedia. I wrote a short tutorial to help people do that more accurately and effectively.
The days when teachers and professors banned students from citing Wikipedia are perhaps not entirely behind us, but do you know what to do if you find yourself in a situation where it is socially/professionally acceptable to cite Wikipedia (such as one of my classes!) and you want to do so in a responsible, durable way?
More specifically, what can you do about the fact that any Wikipedia page you cite can and probably will change? How do you provide a useful citation to a dynamic web resource that is continuously in flux?
This question has come up frequently enough in my classes over the years, that I drafted a short tutorial on doing better Wikipedia citations for my students back in 2020. It’s been through a few revisions since then and I don’t find it completely embarrassing, so I am blogging about it now in the hopes that others might find it useful and share more widely. Also, since it’s on my research group’s wiki, you (and anyone you know) can even make further revisions or chat about it with me on my user:talk page.
You might be thinking, "so wait, does this mean I can cite Wikipedia for anything"??? To which I would respond "Just hold on there, cowboy."
Wikipedia is, like any other information source, only as good as the evidence behind it. In that regard, nothing about my recommendations here make any of the information on Wikipedia any more reliable than it was before. You have to use other skills and resources to assess the quality of the information you’re citing on Wikipedia (e.g., the content/quality of the references used to support the claims made in any given article).
Like I said above, the problem this really tries to solve is more about how to best cite something on Wikipedia, given that you have some good reason to cite it in the first place.
One of the fun things about being in a large lab is getting to celebrate everyone’s accomplishments, wins, and the good stuff that happens. Here is a brief-ish overview of some real successes from 2022.
Our 2022 Fall Retreat!
Graduations and New Positions
Our lab gained SIX new grad student members, Kevin Ackermann, Yibin Fang, Ellie Ross, Dyuti Jha, Hazel Chu, and Ryan Funkhouser. Kevin is a first year graduate student at Northwestern and Yibin and Ellie are first year students at University of Washington. Dyuti, Hazel, and Ryan joined us via Purdue and become Jeremy Foote’s first ever advisees. We had quite a number of undergraduate RAs. We also gained Divya Sikka from Interlake High School.
Nick Vincent became Dr. Nick Vincent, Ph.D (Northwestern). He will do a postdoc at the University of California Davis and University of Washington. Molly de Blanc earned their master’s degree (New York University). Dr. Nate TeBlunthius joined the University of Michigan as a post-doc, working with Professor Ceren Budak.
Kaylea Champion and Regina Cheng had their dissertation proposals approved and Floor Fiers finished their qualifying exams and is now a Ph.D. candidate. Carl Colglaizer finished his coursework.
Aaron Shaw started an appointment as the Scholar-in-Residence for King County, Washington, as well as Visiting Professor in the Department of Communication at the University of Washington.
Teaching
As faculty, it is expected that Jeremy Foote, Mako Hill, Sneha Narayan, and Aaron Shaw taught classes. As a class teaching assistant, Kaylea won an Outstanding Teaching Award! Floor also taught a public speaking class. CDSC members were also teaching assistants, led workshops, and gave guest lectures in classes.
This list is far from complete, including some highlights!
Carl presented at ICA alongside Nicholas Diakopoulos, “Predictive Models in News Coverage of the COVID-19 Pandemic in the United States.”
Floor was present at the Easter Sociological Society (ESS), AoIR (Association of Internet Researchers), and ICA. They won a top paper award at National Communication Association (NCA): Walter, N., Suresh, S., Brooks, J. J., Saucier, C., Fiers, F., & Holbert, R. L. (2022, November). The Chaffee Principle: The Most Likely Effect of Communication…Is Further Communication. National Communication Association (NCA) National Convention, New Orleans, LA.
Kaylea had a whopping two papers at ICA, a keynote at the IEEE Symposium on Digital Privacy and Social Media, and presentations at CSCW Doctoral Consortium, a CSCW workshop, and the DUB Doctoral Consortium. She also participated in Aaron Swartz Day, SeaGL, CHAOSSCon, MozFest, and an event at UMASS Boston.
Molly also participated in Aaron Swartz Day, and a workshop at CSCW on volunteer labor and data.
Sohyeon was at GLF as a knowledge steward and presented two posters at the HCI+D Lambert Conference (one with Emily Zou and one with Charlie Kiene, Serene Ong, and Aaron). She also presented at ICWSM, had posters at ICSSI and IC2S2, and organized a workshop at CSCW. In addition to more traditional academic presentations, Sohyeon was on a fireside chat panel hosted by d/arc server, guest lectured at the University of Washington and Northwestern, and met with Discord moderators to talk about heterogeneity in online governance. Sohyeon also won the Half-Bake Off at the CDSC fall retreat.
Public Scholarship
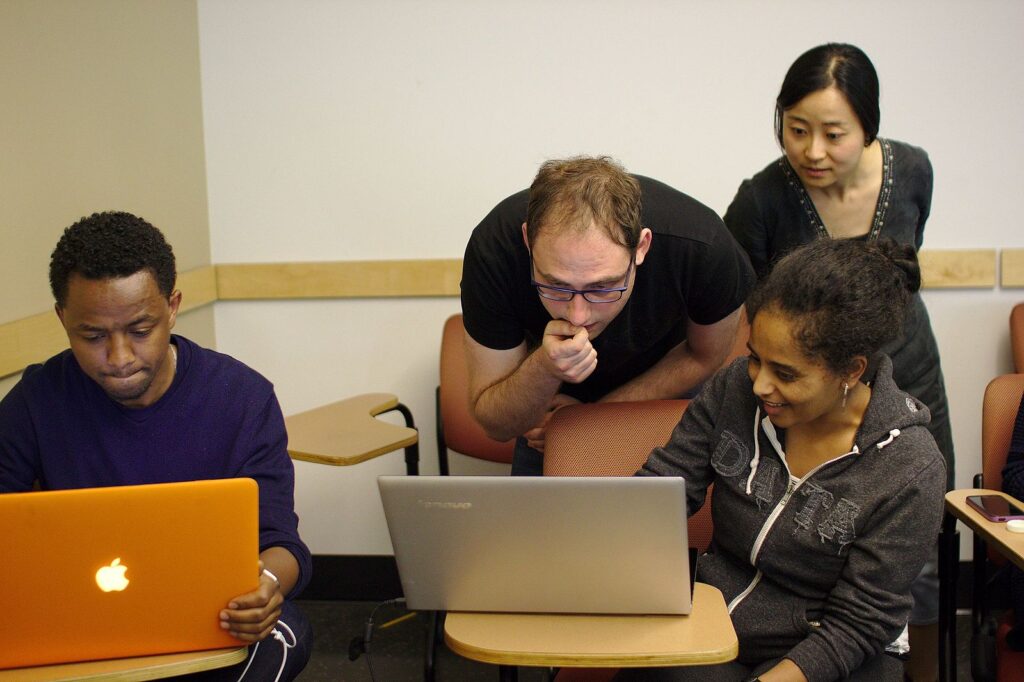
This image is from 2016
We did a lot of public scholarship this year! Among presentations, leading workshops, and organizing public facing events, CDSC also ran the Science of Community Dialogue Series. Presenters from within CDSC include Jeremy Foote, Sohyeon Hwang, Nate TeBlunthius, Charlie Kiene, Kaylea Champion, Regina Cheng, and Nick Vincent. Guest speakers included Dr. Shruti Sannon, Dr. Denae Ford, and Dr. Amy X. Zhang. To attend future Dialogues, sign up for our low-volume email list!
These events are organized by Molly, with assistance from Aaron and Mako.
How can communities develop and understand accountable governance? So many online environments rely on community members in profound ways without being accountable to them in direct ways. In this session, we will explore this topic and its implications for online communities and platforms.
First, Nick Vincent (Northwestern, UC Davis) will discuss the opportunities for so-called “data leverage” and will highlight the potential to push back on the “data status quo” to build compelling alternatives, including the potential for “data dividends” that allow a broader set of users to economically benefit from their contributions.
The idea of “data leverage” comes out of a basic, but little discussed fact: Many technologies are highly reliant on content and behavioral traces created by everyday Internet users, and particularly online community members who contribute text, images, code, editorial judgement, rankings, ratings, and more.. The technologies that rely on these resources include ubiquitous and familiar tools like search engines as well as new bleeding edge “Generative AI” systems that produce novel art, prose, code and more. Because these systems rely on contributions from Internet users, collective action by these users (for instance, withholding content) has the potential to impact system performance and operators.
Next, Amy Zhang (University of Washington) will discuss how communities can think about their governance and the ways in which the distribution of power and decision-making are encoded into the online community software that communities use. She will then describe a tool called PolicyKit that has been developed with the aim of breaking out of common top-down models for governance in online communities to enable governance models that are more open, transparent, and democratic. PolicyKit works by integrating with a community’s platform(s) of choice for online participation (e.g., Slack, Github, Discord, Reddit, OpenCollective), and then provides tools for community members to create a wide range of governance policies and automatically carry out those policies on and across their home platforms. She will then conclude with a discussion of specific governance models and how they incorporate legitimacy and accountability in their design.
In The Wealth Of Networks, Yochai Benkler describes the opportunities and decisions presented by networked forms of production. Writing in the mid-2000s, Benkler describes a wide range of future policy battlegrounds: copyrights and patents, common carrier infrastructure, the accessibility of the public sphere, and the verification of information.
Benkler predicts: “How these battles turn out over the next decade or so will likely have a significant effect on how we come to know what is going on in the world we occupy, and to what extent and in what forms we will be able…to affect how we and others see the world as it is and as it might be.”
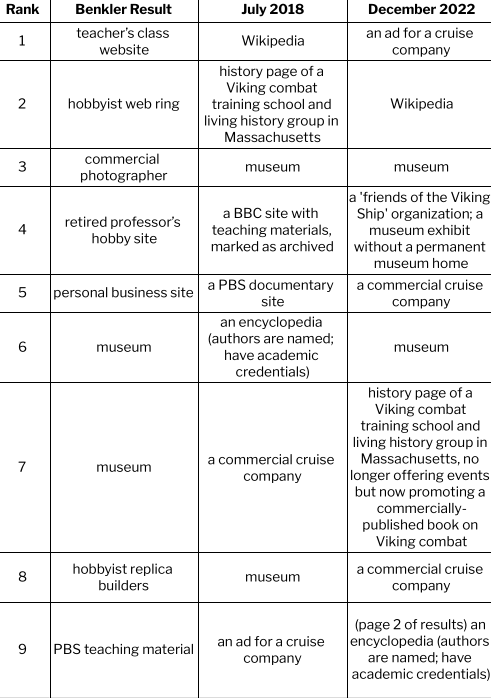
Benkler uses two simple search examples, reporting the results of searching for “Viking ship” and “Barbie”. He finds that enthusiastic individuals and independent voices dominate the content we see on the web and that various search engines construct meaning in varying ways. I repeat his examples (searches conducted 7/3/2018 and 12/1/2022, from my home near Seattle, WA and using my personal laptop).
So how do ‘we come to know what is going on in the world we occupy’? Who creates what we see online? And what implications does that have for our own freedom to shape the world? The short version of the answer to this question seems to be: if there was a battle, it’s over now and the wreckage has disappeared; individuals and independent voices are marginalized and commercial content is dominant — and this picture does not vary among search engines.
Viking Ships
I used the same search engine (Google) and the same term (Viking Ship): what I see is that the individual hobbyists Benkler saw in 2006 are eclipsed by institutions. The materials on the current sites sound similar to those Benkler saw – photos, replicas, and scholarly information, as well as links and learning materials – but the production is generally institutional and formal in contrast to the individual and informal sources Benkler reports.
One other shift: in 2022, simply listing links in order is not sufficient to report what searchers see. Search results are interspersed with many other features: a widget with “sources from across the web”, an images display with associated keywords, a “People also ask” widget, and a related searches widget; to reach the 9th “result” in the classic sense, I have to browse to the second page of results.
Searching for ‘Viking Ship’ in 2006, 2018, and 2022
Barbie
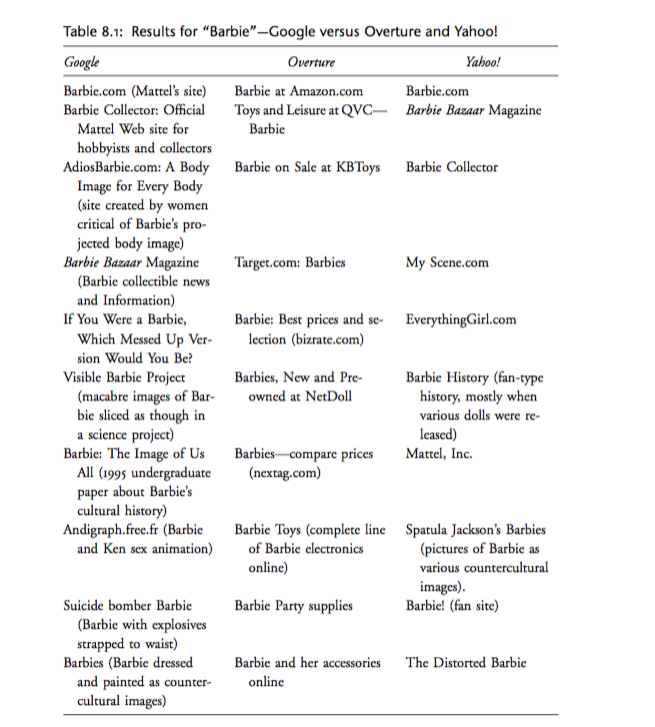
When I follow Benkler’s lead and search for ‘Barbie’ using three different search engines, the results are even more different from 2006. Benkler describes differences in search engine results as revealing different possibilities – via Google, Barbie was portrayed as “a culturally contested figure”, whereas on Overture (a now-defunct shopping-oriented search engine), the searcher encountered “a commodity toy.”
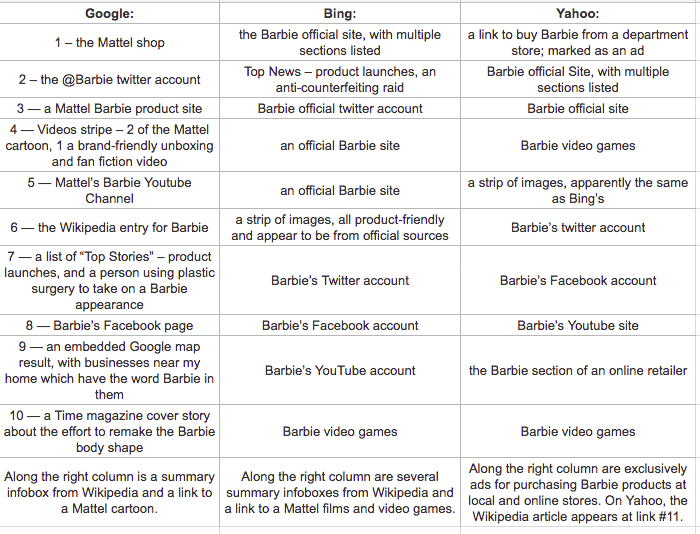
By contrast, my 2018 search via the then-current top 3 search engines, inclusive of widgets and other features, revealed:
Searching for ‘Barbie’ via the top 3 search engines in 2018.
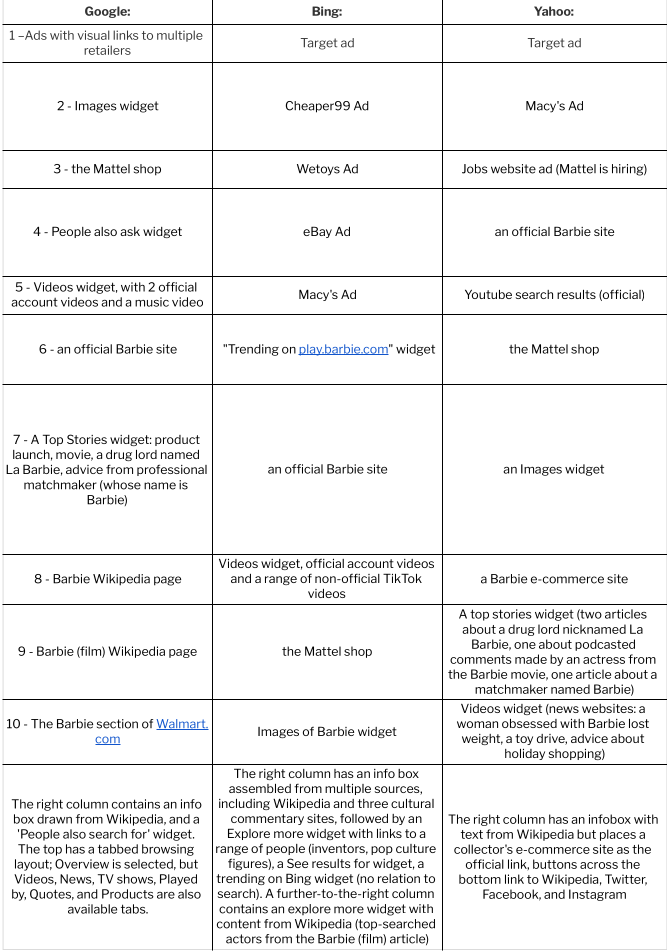
The top search engines in 2022 are the same three firms, although I observe that some sources suggest DuckDuckGo, Baidu (Chinese language only) and Yandex (Russian) belong in a top 5; other sources treat YouTube and Amazon as “top search engines” although they are not actually search engines. My 2022 search, inclusive of widgets and other features, revealed:
Searching for ‘Barbie’ via the top 3 search engines in 2022.
The modern Barbie searcher encounters primarily a multiplatform brand, with some hints of cultural constructions. In 2018 this took the form of extreme plastic surgery and brand-friendly fan fiction, in 2022 weight loss and fan TikTok. To whatever degree search engine algorithms continue to give weight to alternate voices in this case, they are largely drowned out by the volume of the commercial voice: the meaning of a search query for the single term “Barbie” has been substantially narrowed since Benkler’s time, and perhaps has narrowed even further in the last four and a half years.
The web in 2006 was indeed a different place, and I have commented on additional dimensions of analysis not present in Wealth: embedding of visual and social media content, and the widgetizing of content. In 2018, these visual components were less dominant: a stripe of Viking Ship images and a stripe of Barbie videos. In 2022 search, the page can scarcely be described without them.
We can now answer Benkler’s challenge: how did “these battles” over the last decade and a half “turn out”?
How do we “come to know what is going on in the world we occupy”?
How are we able “to affect how we and others see the world as it is and as it might be”?
The answer seems to be, it’s unclear to what degree there was a battle at all: collectives have triumphed over individuals on the Web insofar as search engines represent it. These collectives are generally firms, although some formal institutions are also present: news media, Wikipedia, and (in the case of Viking Ship) museums.
The implications of our search environment are significant, and underscore the necessity of efforts to archive and capture the search landscape as it appeared. The role of platforms and institutions in constructing our understanding of the world should be of key concern in information and communication sciences.
For civil society groups, these results suggest alienation: the commercializing of the web has been accompanied by a narrowing of outlets for individual expression and critique, with Wikipedia and its community co-construction of knowledge a vital bright spot. For journalists, these results suggest the vital role of cultural reporting. For firms, the challenge is one of authenticity and connection: to the extent that the web has become a broadcast medium focused on official paid messaging, the opportunity to engage with consumers is lost, and along with it a spark for innovation. Search platforms benefit in the mean time, as jockeying for ad positioning between manufacturers and retailers drives revenue, at least until commercialism turns consumer attention elsewhere.