How can communities develop and understand accountable governance? So many online environments rely on community members in profound ways without being accountable to them in direct ways. In this session, we will explore this topic and its implications for online communities and platforms.
First, Nick Vincent (Northwestern, UC Davis) will discuss the opportunities for so-called “data leverage” and will highlight the potential to push back on the “data status quo” to build compelling alternatives, including the potential for “data dividends” that allow a broader set of users to economically benefit from their contributions.
The idea of “data leverage” comes out of a basic, but little discussed fact: Many technologies are highly reliant on content and behavioral traces created by everyday Internet users, and particularly online community members who contribute text, images, code, editorial judgement, rankings, ratings, and more.. The technologies that rely on these resources include ubiquitous and familiar tools like search engines as well as new bleeding edge “Generative AI” systems that produce novel art, prose, code and more. Because these systems rely on contributions from Internet users, collective action by these users (for instance, withholding content) has the potential to impact system performance and operators.
Next, Amy Zhang (University of Washington) will discuss how communities can think about their governance and the ways in which the distribution of power and decision-making are encoded into the online community software that communities use. She will then describe a tool called PolicyKit that has been developed with the aim of breaking out of common top-down models for governance in online communities to enable governance models that are more open, transparent, and democratic. PolicyKit works by integrating with a community’s platform(s) of choice for online participation (e.g., Slack, Github, Discord, Reddit, OpenCollective), and then provides tools for community members to create a wide range of governance policies and automatically carry out those policies on and across their home platforms. She will then conclude with a discussion of specific governance models and how they incorporate legitimacy and accountability in their design.
In The Wealth Of Networks, Yochai Benkler describes the opportunities and decisions presented by networked forms of production. Writing in the mid-2000s, Benkler describes a wide range of future policy battlegrounds: copyrights and patents, common carrier infrastructure, the accessibility of the public sphere, and the verification of information.
Benkler predicts: “How these battles turn out over the next decade or so will likely have a significant effect on how we come to know what is going on in the world we occupy, and to what extent and in what forms we will be able…to affect how we and others see the world as it is and as it might be.”
Benkler uses two simple search examples, reporting the results of searching for “Viking ship” and “Barbie”. He finds that enthusiastic individuals and independent voices dominate the content we see on the web and that various search engines construct meaning in varying ways. I repeat his examples (searches conducted 7/3/2018 and 12/1/2022, from my home near Seattle, WA and using my personal laptop).
So how do ‘we come to know what is going on in the world we occupy’? Who creates what we see online? And what implications does that have for our own freedom to shape the world? The short version of the answer to this question seems to be: if there was a battle, it’s over now and the wreckage has disappeared; individuals and independent voices are marginalized and commercial content is dominant — and this picture does not vary among search engines.
Viking Ships
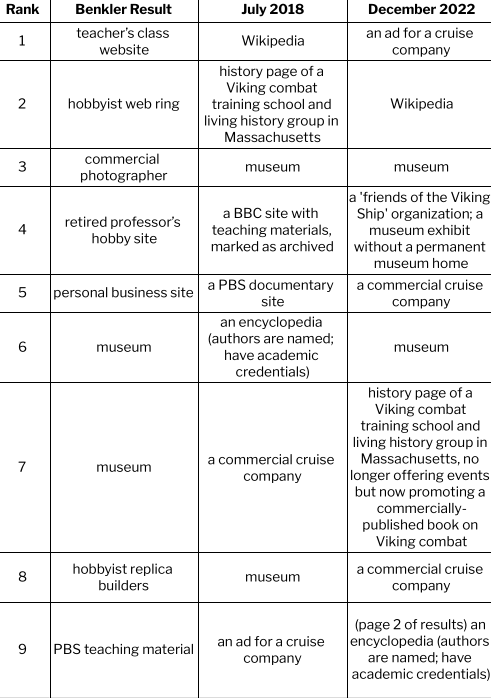
I used the same search engine (Google) and the same term (Viking Ship): what I see is that the individual hobbyists Benkler saw in 2006 are eclipsed by institutions. The materials on the current sites sound similar to those Benkler saw – photos, replicas, and scholarly information, as well as links and learning materials – but the production is generally institutional and formal in contrast to the individual and informal sources Benkler reports.
One other shift: in 2022, simply listing links in order is not sufficient to report what searchers see. Search results are interspersed with many other features: a widget with “sources from across the web”, an images display with associated keywords, a “People also ask” widget, and a related searches widget; to reach the 9th “result” in the classic sense, I have to browse to the second page of results.
Searching for ‘Viking Ship’ in 2006, 2018, and 2022
Barbie
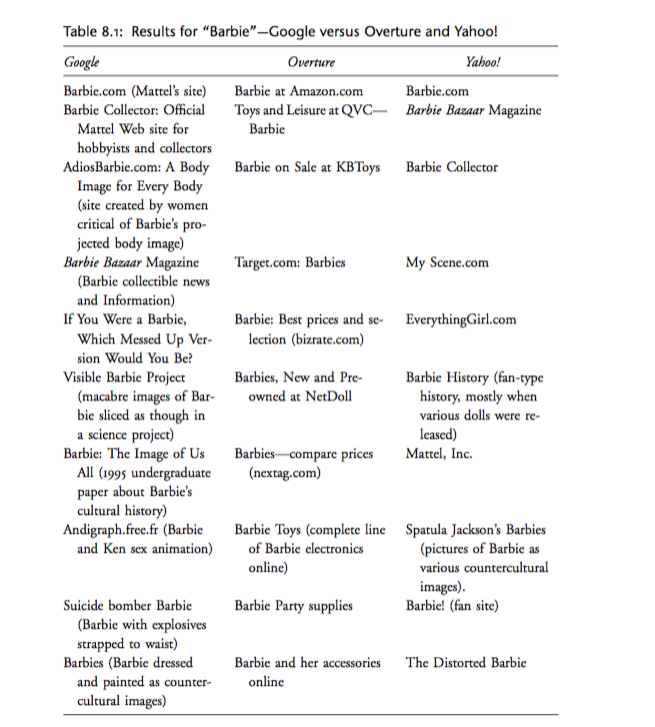
When I follow Benkler’s lead and search for ‘Barbie’ using three different search engines, the results are even more different from 2006. Benkler describes differences in search engine results as revealing different possibilities – via Google, Barbie was portrayed as “a culturally contested figure”, whereas on Overture (a now-defunct shopping-oriented search engine), the searcher encountered “a commodity toy.”
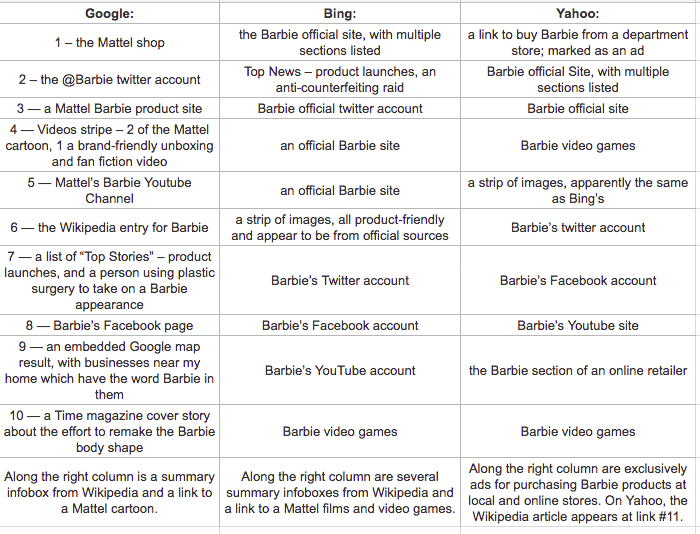
By contrast, my 2018 search via the then-current top 3 search engines, inclusive of widgets and other features, revealed:
Searching for ‘Barbie’ via the top 3 search engines in 2018.
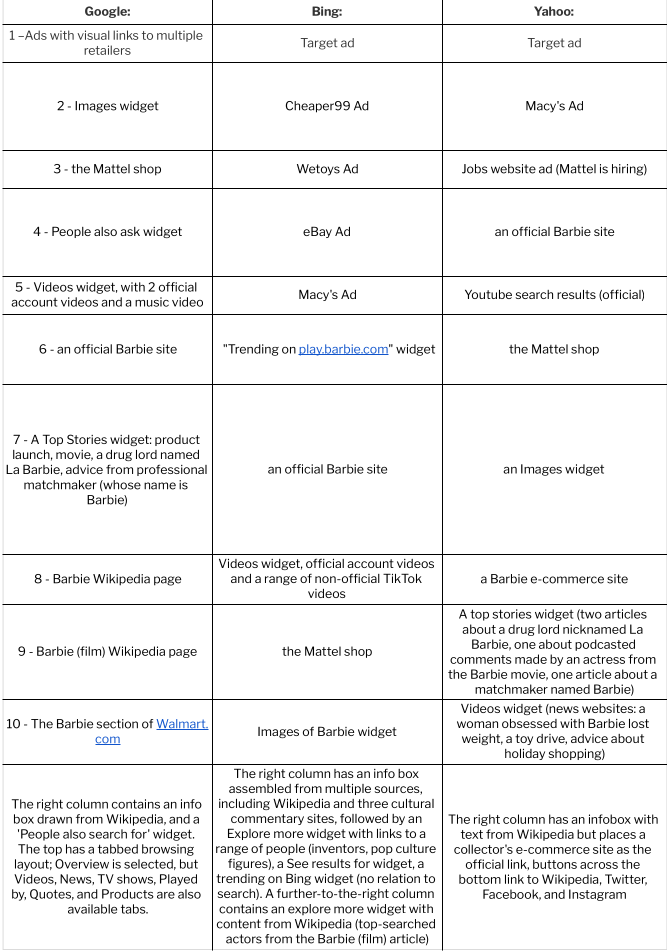
The top search engines in 2022 are the same three firms, although I observe that some sources suggest DuckDuckGo, Baidu (Chinese language only) and Yandex (Russian) belong in a top 5; other sources treat YouTube and Amazon as “top search engines” although they are not actually search engines. My 2022 search, inclusive of widgets and other features, revealed:
Searching for ‘Barbie’ via the top 3 search engines in 2022.
The modern Barbie searcher encounters primarily a multiplatform brand, with some hints of cultural constructions. In 2018 this took the form of extreme plastic surgery and brand-friendly fan fiction, in 2022 weight loss and fan TikTok. To whatever degree search engine algorithms continue to give weight to alternate voices in this case, they are largely drowned out by the volume of the commercial voice: the meaning of a search query for the single term “Barbie” has been substantially narrowed since Benkler’s time, and perhaps has narrowed even further in the last four and a half years.
The web in 2006 was indeed a different place, and I have commented on additional dimensions of analysis not present in Wealth: embedding of visual and social media content, and the widgetizing of content. In 2018, these visual components were less dominant: a stripe of Viking Ship images and a stripe of Barbie videos. In 2022 search, the page can scarcely be described without them.
We can now answer Benkler’s challenge: how did “these battles” over the last decade and a half “turn out”?
How do we “come to know what is going on in the world we occupy”?
How are we able “to affect how we and others see the world as it is and as it might be”?
The answer seems to be, it’s unclear to what degree there was a battle at all: collectives have triumphed over individuals on the Web insofar as search engines represent it. These collectives are generally firms, although some formal institutions are also present: news media, Wikipedia, and (in the case of Viking Ship) museums.
The implications of our search environment are significant, and underscore the necessity of efforts to archive and capture the search landscape as it appeared. The role of platforms and institutions in constructing our understanding of the world should be of key concern in information and communication sciences.
For civil society groups, these results suggest alienation: the commercializing of the web has been accompanied by a narrowing of outlets for individual expression and critique, with Wikipedia and its community co-construction of knowledge a vital bright spot. For journalists, these results suggest the vital role of cultural reporting. For firms, the challenge is one of authenticity and connection: to the extent that the web has become a broadcast medium focused on official paid messaging, the opportunity to engage with consumers is lost, and along with it a spark for innovation. Search platforms benefit in the mean time, as jockeying for ad positioning between manufacturers and retailers drives revenue, at least until commercialism turns consumer attention elsewhere.
Wiki Education (a.k.a., WikiEdu) is an independent non-profit organization that promotes the integration of Wikipedia into education and classrooms. In pursuit of this mission, WikiEdu has created incredible resources for students and instructors, including tools that facilitate classroom assignments where students create and improve Wikipedia articles.
Wiki Education is great! (And the feeling seems to be mutual based on their recent blogposts)
In courses at both Northwestern and the University of Washington, CDSC faculty and students have offered courses with Wikipedia assignments for over a decade. In the past two weeks, WikiEdu has featured the most recent instances of these courses on their blog.
The first WikiEdu post celebrated the work of a team of Northwestern students that included Carl Colglazier (TSB and CDSC Ph.D. student) and Hannah Yang (undergraduate Communication Studies major and former CDSC research assistant). The team, all members of the Online Communities & Crowds course I taught with CDSC Ph.D. student Sohyeon Hwang in Winter 2022, overhauled an article on Inclusive design in English Wikipedia. Since the article’s initial publication back in March, other Wikipedia editors have improved it further and it has attracted over 10,000 pageviews. Amazing work, team!
The second post celebrates UW Communication doctoral student Kaylea Champion, recipient of an Outstanding Teaching Award from the Communication Department on the strength of her work in another Winter 2022 undergraduate course on Online Communities (also taught by Benjamin Mako Hill) that features a Wikipedia assignment. Several of Kaylea’s students thought so highly of her work in the course that they collaborated in nominating her for the award. Kaylea enjoyed the experience enough that she’s about to offer the course again as the lead instructor at UW this upcoming Winter term. I should also note that Kaylea has been nominated for a university-wide award, but we won’t know the outcome of that process for a while yet. Congratulations, Kaylea!
The public recognition of CDSC students and teaching is gratifying and provides a great reminder of why assignments that ask students to edit Wikipedia are so valuable in the first place. Most fundamentally, editing Wikipedia engages students in the production of public, open access knowledge resources that serve a much greater and broader purpose than your typical term paper, pop quiz, or exam. When students develop encyclopedic materials on topics of their interest, motivated undergraduates like Hannah Yang can directly connect coursework with practical, real-world concerns in ways that build on the expertise of graduate students like Carl Colglazier. This kind of school work creates unusually high impact products. Kaylea Champion puts the idea eloquently in that WikiEdu post: “Instead of locking away my synthesis efforts in a paper no one but my instructors would read, the Wikipedia assignment pushed me to address the public.”
Just think, how many people ever read a word of most college (or high school or graduate school) term papers? By contrast, the Wikipedia articles created by our students have routinely been viewed over 100,000 times in aggregate by the end of the term in which we offer the course. Extrapolate this out over a decade and our students’ work has likely been read millions of times by now. As with other content on Wikipedia, this work will shape public discourse, including judicial decisions, scientific research, search engine results, and more. There’s absolutely nothing academic about that!
We had another Science of Community Dialogue! This most recent one was themed around informal learning, talking about communities as informal learning spaces and the sorts of tools and habits communities can adopt to help learners, mentors, and newcomers. We had presentations from Ruijia (Regina) Cheng (University of Washington, CDSC) and Dr. Denae Ford Robinson (Microsoft, University of Washington).
Regina Cheng covered three related research projects and relevant findings:
Ruijia Cheng and Benjamin Mako Hill. 2022. “Many Destinations, Many Pathways: A Quantitative Analysis of Legitimate Peripheral Participation in Scratch.” https://doi.org/10.1145/3555106
Ruijia Cheng, Sayamindu Dasgupta, and Benjamin Mako Hill. 2022. “How Interest-Driven Content Creation Shapes Opportunities for Informal Learning in Scratch: A Case Study on Novices’ Use of Data Structures.” https://doi.org/10.1145/3491102.3502124
Ruijia Cheng and Jenna Frens. 2022. “Feedback Exchange and Online Affinity: A Case Study of Online Fanfiction Writers.” https://doi.org/10.1145/3555127
Participants collaboratively put together three takeaways from Regina Cheng’s presentation.
We often talk about wanting to support “learning” in some general sense, but a critically important question to ask is “learning about what.” Let’s say we want people to learn three things A, B, and C. The kinds of actions or behaviors that support learning goal A often have no effect on B, and C. And sometimes they actively hurt it. We need to be more specific about what we want people to learn because there are tradeoffs.
Social support is wonderful in that users create examples and resources and answer questions. But it also has this narrowing effect. There’s a piling-on effect that makes it easier and easier (and more likely!) to learn the things that folks have learned before and less likely that people learn anything else.
Feedback is not about information transfer, it’s about relationships. To best promote learning, we should create rich, legitimate, inclusive social environment. These are perhaps good things to do anyway.
Dr. Denae Ford Robinson focused on free and open source software (FOSS) communities as a case study of learning communities. She covered theory, needs, and demonstrated tools designed to help with the mentorship and the learning process.
Community-driven settings like FOSS (and social-good oriented projects in particular) rely enormously on volunteers and/or people opting into participation in ways that create huge challenges related to promoting project sustainability: the most active participants are overloaded in a way that is a recipe for burnout.
The path to sustainability involves attracting, retaining, and then sustaining contributions and understanding these processes as both (a) part of the lifecycle of a user and (b) part of a set of dynamics and lifecycle within the community (e.g., dynamics of community growth).
Approach 1 involves providing new information to help maintainers understand how things are going in their communities. A lack of insight and easy access to data is a cause of inefficiency and burnout.
Approach 2 involves making specific, structured recommendations to maintainers based on the experience of others in the past to do things like add tags and to shape behavior.
Approach 3 involves automating aspects of identifying and recognizing work (and perhaps other tasks) as a way of promoting newcomer experiences and reducing the load on maintainers for doing that.
This event and some of the research presented in it were supported by multiple awards from the National Science Foundation (DGE-1842165; IIS-2045055; IIS-1908850; IIS-1910202), Northwestern University, the University of Washington, and Purdue University.
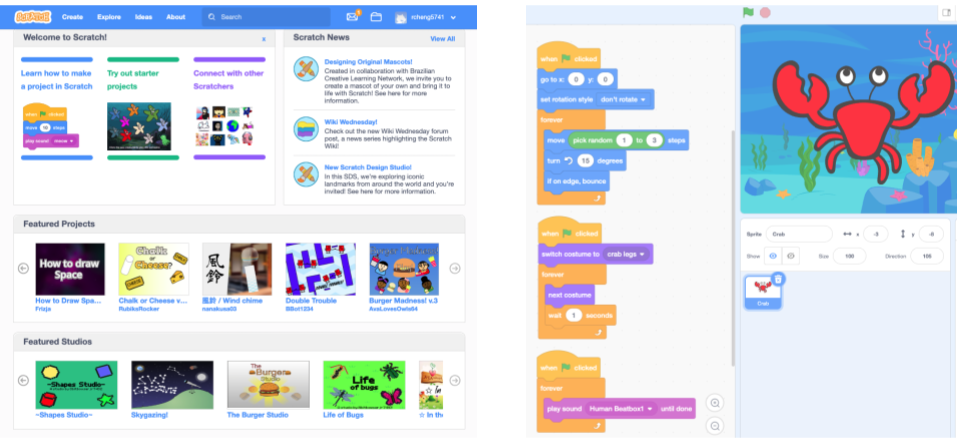
Thousands of widely used online communities are designed to promote learning. Although some rely on formal educational approaches like lesson plans, curriculum, and tests, many of the most successful learning communities online are structured as what scholars call a community of practice (CoP). In CoPs, members mentor and apprentice with each other (both formally and informally) while working toward a common interest or goal. For example, the Scratch online community is a CoP where millions of young people share and collaborate on programming projects.
Despite an enormous amount of attention paid to online CoPs, there is still a lot of disagreement about the best ways to promote learning in them. One source of disagreement stems from the fact that participants in CoPs are learning a number of different kinds of things and designers are often trying to support many types of learning at once. In a new paper that I’ve published—and that I will be presenting at CSCW this week—I conduct quantitative analyses on data from Scratch to show that there is a complex set of learning pathways at play in CoPs like Scratch. Types of participation that are associated with some important kinds of learning are often unrelated to, or even negatively associated with, other important types of learning outcomes.
The Scratch online community (left) and an example of a programming project in Scratch (right).
So what exactly are people learning in CoPs? We dug into the CoP literature and identified three major types of learning outcomes:
Learning about the domain, which refers to learning knowledge and skills for the core tasks necessary for achieving the explicit goal in the community. In Scratch, this is learning to code.
Learning about the community, which means the development of identity as a community member, forming relationships, affinities, and a sense of belonging. In Scratch, this involves learning to interact with others users and developing an identity as a community member.
Learning about the practice, which means adopting community specific values, such as the style of contribution that will be accepted and appreciated by its members. In Scratch, this means becoming a valued and respected contributor to the community.
So what types of participation might contribute to learning in a CoP? We identified several different types of newcomers’ participation that may support learning:
Contribution to core tasks which involves direct work towards the community’s explicit goal. In Scratch, this often involves making original programming projects.
Engagement with practice proxies which involves observing and participating in others’ work practices. In Scratch, this might mean remixing others’ projects by making changes and building on existing code.
Feedback exchange with community members about their contributions. In Scratch, this often involves writing comments on others’ projects.
Social bonding with community members. In Scratch, this can involve “friending” others, which allows a user to follow others’ projects and updates.
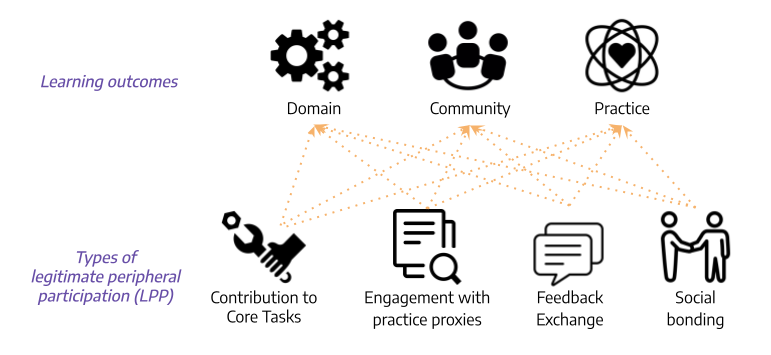
A visual representation of our study design.
We conducted a quantitative analysis on how the different types of newcomer participation contribute to the different learning outcomes. In other words, we tested for the presence/absence and the direction of the relationships (shown as the orange arrows) between each of the learning outcomes on the top of the figure and each of the types of newcomer participation on the bottom. To conduct these tests, we used data from Scratch to construct a user level dataset with proxy measures for each type of learning and type of newcomer participation as well as a series of important control variables. All the technical details about the measures and models are in the paper.
Overall, what we found was a series of complex trade-offs that suggest the kinds of things that support one type of learning frequently do not support others. For example, we found that contribution to core tasks as a newcomer is positively associated with learning about the domain in the long term, but negatively associated with learning about the community and its practices. We found that engagement with practice proxies as a newcomer is negatively associated with long-term learning about the domain and the community. Engaging in feedback exchange and social bonding as a newcomer, on the other hand, are positively associated with learning about the community and its practice.
Our findings indicate that there are no easy solutions: different types of newcomer participation provide varying support for different learning outcomes. What is productive for some types of learning outcomes can be unhelpful for others, and vice versa. For example, although social features like feedback mechanisms and systems for creating social bonds may not be a primary focus of many learning systems, they could be implemented to help users develop a sense of belonging in the community and learn about community specific values. At the same time, while contributing to core tasks may help with domain learning, direct contribution may often be too difficult and might discourage newcomers from staying in the community and learn about its values.
The paper and this blog post are collaborative work between Ruijia “Regina” Cheng and Benjamin Mako Hill. The paper is being published this month(open access) in the Proceedings of the ACM on Human-Computer Interaction The full citation for this paper is: Ruijia Cheng and Benjamin Mako Hill. 2022. Many Destinations, Many Pathways: A Quantitative Analysis of Legitimate Peripheral Participation in Scratch. Proc. ACM Hum.-Comput. Interact. 6, CSCW2, Article 381 (November 2022), 26 pages https://doi.org/10.1145/3555106
The paper is also available as an arXiv preprint and in the ACM Digital Library. The paper is being presented several times at the Virtual CSCW conference taking place in November 2022. Both Regina and Mako are happy to answer questions over email, in the comments on this blog post, or at the one remaining presentation slot at the CSCW conference on November 16th at 8-9pm Pacific Time.
CDSC members Molly deBlanc and Kaylea Champion will be presenting at this year’s Aaron Swartz Day and International Hackathon. Molly will speak at 2:50 p.m. Pacific (talk title: My (Extended) Body, My Choice). Kaylea will speak at 3:15 p.m. Pacific (talk title: The Value of Anonymity: Evidence from Wikipedia). Registration and live stream details are available here: https://www.aaronswartzday.org/
If you’re attending ACM-CSCW this year, you are warmly invited to join CDSC members during our talks and other scheduled events. CSCW is not only virtual but spread across multiple weeks and offering sessions multiple times to accommodate timezones. We hope to see you there — we are eager to discuss our work with you!
Tuesday, November 8
6pm-7pm Pacific, “No Community Can Do Everything: Why People Participate in Similar Online Communities” Details at: https://programs.sigchi.org/cscw/2022/index/content/87413 By: Nathan Te Blunthuis, Charles Kiene, Isabella Brown, Nicole McGinnis, Laura Levi, Benjamin Mako Hill
3am-4am Pacific “The Risks, Benefits, and Consequences of Prepublication Moderation: Evidence from 17 Wikipedia Language Editions” Details at: https://programs.sigchi.org/cscw/2022/index/content/87945 By:Chau Tran, Kaylea Champion, Benjamin Mako Hill, Rachel Greenstadt
Friday, November 11
8am-9am Pacific. Many Destinations, Many Pathways: A Quantitative Analysis of Legitimate Peripheral Participation in Scratch. Details at: https://programs.sigchi.org/cscw/2022/index/content/87487 By: Ruijia Cheng, Benjamin Mako Hill
3pm-4pm Pacific “The Risks, Benefits, and Consequences of Prepublication Moderation: Evidence from 17 Wikipedia Language Editions” Details at: https://programs.sigchi.org/cscw/2022/index/content/87945 By: Chau Tran, Kaylea Champion, Benjamin Mako Hill, Rachel Greenstadt
8pm-9pm Pacific. Many Destinations, Many Pathways: A Quantitative Analysis of Legitimate Peripheral Participation in Scratch. Details at: https://programs.sigchi.org/cscw/2022/index/content/87487 By: Ruijia Cheng, Benjamin Mako Hill
Friday, November 18
6am-7am Pacific, “No Community Can Do Everything: Why People Participate in Similar Online Communities” Details at: https://programs.sigchi.org/cscw/2022/index/content/87413 By: Nathan Te Blunthuis, Charles Kiene, Isabella Brown, Nicole McGinnis, Laura Levi, Benjamin Mako Hill
And there’s more…
CDSC members and affiliates are involved in CSCW beyond these public presentations. Nicholas Vincent, Sohyeon Hwang, and Sneha Narayan are part of the organizing team for the “Ethical Tensions, Norms, and Directions in the Extraction of Online Volunteer Work” workshop, where Molly de Blanc is scheduled to present and Kaylea Champion will be giving a lightning talk. Katherina Kloppenborg and Kaylea Champion are presenting in the Doctoral Consortium.
It’s Ph.D. application season and the Community Data Science Collective is recruiting! As always, we are looking for talented people to join our research group. Applying to one of the Ph.D. programs that the CDSC faculty members are affiliated with is a great way to get involved in research on communities, collaboration, and peer production.
Because we know that you may have questions for us that are not answered in this webpage, we will be hosting a panel discussion and Q&A about the CDSC and Ph.D. opportunities on October 20 at 7:30pm UTC (3:30pm US Eastern, 2:30pm US Central, 12:30pm US Pacific). You can register online.
This post provides a very brief run-down on the CDSC, the different universities and Ph.D. programs our faculty members are affiliated with, and some general ideas about what we’re looking for when we review Ph.D. applications.
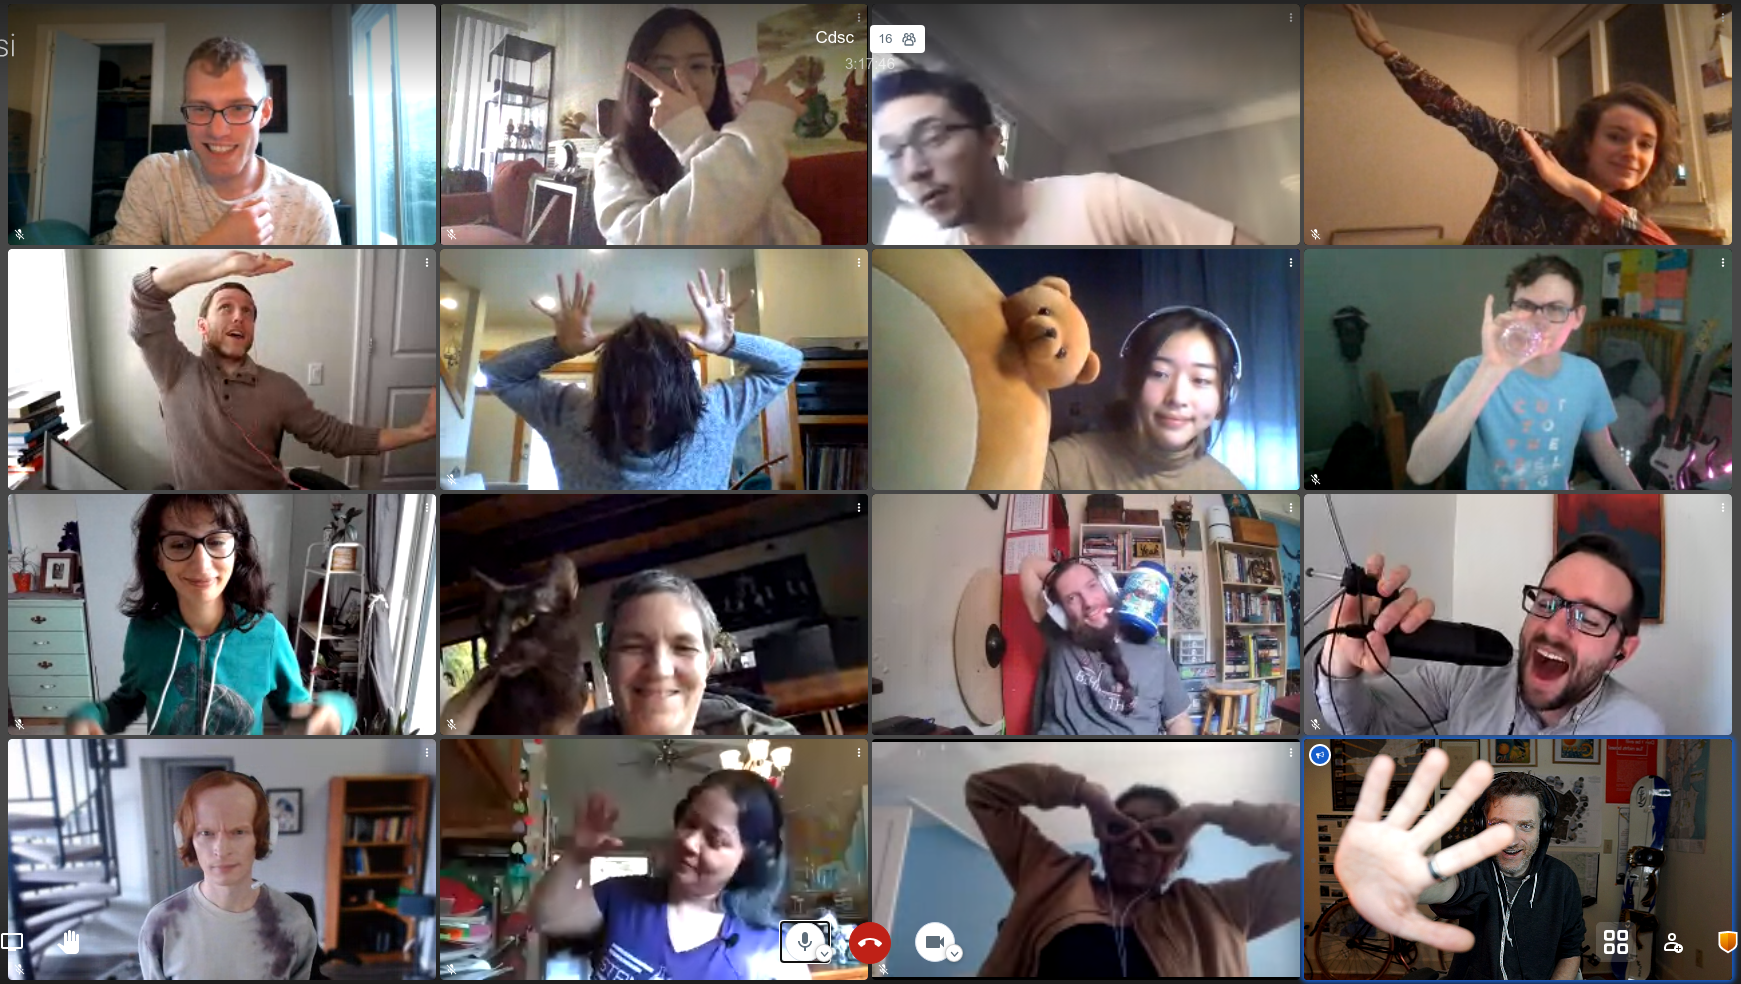
Group photo of the collective at a recent virtual retreat.
What are these different Ph.D. programs? Why would I choose one over the other?
This year the group includes three faculty principal investigators (PIs) who are actively recruiting PhD students: Aaron Shaw (Northwestern University), Benjamin Mako Hill (University of Washington in Seattle), and Jeremy Foote (Purdue University). Each of these PIs advise Ph.D. students in Ph.D. programs at their respective universities. Our programs are each described below.
Although we often work together on research and serve as co-advisors to students in each others’ projects, each faculty person has specific areas of expertise and interests. The reasons you might choose to apply to one Ph.D. program or to work with a specific faculty member could include factors like your previous training, career goals, and the alignment of your specific research interests with our respective skills.
At the same time, a great thing about the CDSC is that we all collaborate and regularly co-advise students across our respective campuses, so the choice to apply to or attend one program does not prevent you from accessing the expertise of our whole group. But please keep in mind that our different Ph.D. programs have different application deadlines, requirements, and procedures!
Who is actively recruiting this year?
If you are interested in applying to any of the programs, we strongly encourage you to reach out the specific faculty in that program before submitting an application.
Ph.D. Advisors
Benjamin Mako Hill
Benjamin Mako Hill is an Associate Professor of Communication at the University of Washington. He is also an Adjunct Assistant Professor at UW’s Department of Human-Centered Design and Engineering (HCDE), Computer Science and Engineering (CSE) and Information School. Although many of Mako’s students are in the Department of Communication, he has also advised students in all three other departments—although he typically has more limited ability to admit students into those programs on his own and usually does so with a co-advisor in those departments. Mako’s research focuses on population-level studies of peer production projects, computational social science, efforts to democratize data science, and informal learning. Mako has also put together a webpage for prospective graduate students with some useful links and information..
AaronShaw is an Associate Professor in the Department of Communication Studies at Northwestern. This year, he’s also the “Scholar in Residence” for King County, Washington. In terms of Ph.D. programs, Aaron’s primary affiliations are with the Media, Technology and Society (MTS) and the Technology and Social Behavior (TSB) Ph.D. programs (please note: the TSB program is a joint degree between Communication and Computer Science). Aaron also has a courtesy appointment in the Sociology Department at Northwestern, but he has not directly supervised any Ph.D. advisees in that department (yet). Aaron’s current projects focus on comparative analysis of the organization of peer production communities and social computing projects, participation inequalities in online communities, and collaborative organizing in pursuit of public goods.
Jeremy Foote
Jeremy Foote is an Assistant Professor at the Brian Lamb School of Communication at Purdue University. He is affiliated with the Organizational Communication and Media, Technology, and Society programs. Jeremy’s current research focuses on how individuals decide when and in what ways to contribute to online communities, how communities change the people who participate in them, and how both of those processes can help us to understand which things become popular and influential. Most of his research is done using data science methods and agent-based simulations.
What do you look for in Ph.D. applicants?
There’s no easy or singular answer to this. In general, we look for curious, intelligent people driven to develop original research projects that advance scientific and practical understanding of topics that intersect with any of our collective research interests.
To get an idea of the interests and experiences present in the group, read our respective bios and CVs (follow the links above to our personal websites). Specific skills that we and our students tend to use on a regular basis include consuming and producing social science and/or social computing (human-computer interaction) research; applied statistics and statistical computing, various empirical research methods, social theory and cultural studies, and more.
Formal qualifications that speak to similar skills and show up in your resume, transcripts, or work history are great, but we are much more interested in your capacity to learn, think, write, analyze, and/or code effectively than in your credentials, test scores, grades, or previous affiliations. It’s graduate school and we do not expect you to show up knowing how to do all the things already.
Intellectual creativity, persistence, and a willingness to acquire new skills and problem-solve matter a lot. We think doctoral education is less about executing tasks that someone else hands you and more about learning how to identify a new, important problem; develop an appropriate approach to solving it; and explain all of the above and why it matters so that other people can learn from you in the future. Evidence that you can or at least want to do these things is critical. Indications that you can also play well with others and would make a generous, friendly colleague are really important too.
All of this is to say, we do not have any one trait or skill set we look for in prospective students. We strive to be inclusive along every possible dimension. Each person who has joined our group has contributed unique skills and experiences as well as their own personal interests. We want our future students and colleagues to do the same.
Now what?
Still not sure whether or how your interests might fit with the group? Still have questions? Still reading and just don’t want to stop? Follow the links above for more information. Feel free to send at least one of us an email. We are happy to try to answer your questions and always eager to chat. You can also join our panel discussion on October 20 at 3:30pm ET (UTC-5).
Although we might not notice it, much of the technology we rely on, from cell phones to cloud servers, is fueled by decades of effort by volunteers who create innovative software as well as the organizations necessary to sustain it. Despite this powerful legacy, we now are facing a crisis: not all of these critical components have been sufficiently maintained. Can we detect that an important software component is becoming neglected before major failures occur? Are these neglected packages just a matter of resources — old code and too few contributors — or can we see broader patterns that play a role, such as collaboration and organizational structures? Kaylea Champion has been working to answer these questions in her dissertation. As part of this work, she joined the software community metrics enthusiasts gathered at this year’s CHAOSSCon EU on September 12, 2022 as part of the Open Source Summit.
Kaylea’s presentation shares work in progress about the sources of underproduction, or when highly important packages see low quality development, in open software development. This presentation marks her second time at CHAOSSCon and builds on her work shared at last year’s conference in a lightning talk about detecting underproduction in Debian (see coverage of this work as presented to Debian folks here). Engaging with communities is a key part of this work: when we understand practitioner perspectives on underproduction and its causes, we can do science that supports taking immediate action. If you are interested in measuring the health of your collaborative community, let’s talk!
How should search engines be regulated? What are the implications of the EU Digital Services Act? If you are interested in technology policy, mark your calendar for an upcoming pre-conference virtual event: “Harms and Standards in Content Platform Governance” (October 13, 2022 at 5:00 a.m. PST, 8:00 a.m EST, 2:00 p.m. CEST). As part of the upcoming European Communication Research and Education conference, the Communication Law and Policy section has invited Kaylea Champion to present work she did with Benjamin Mako Hill and University of Washington students Jacinta Harshe, Isabella Brown, and Lucy Bao.
We examine the information landscape as manifested in search results during the Covid-19 pandemic using data we collected as part of the Covid-19 Digital Observatory Project. Our results provide evidence for the powerful ways that search engines shape our information environment–in terms of what information gets seen, the sources of that information, the market sectors that those sources operate within, and the partisan bias of those results.
This free event is oriented to connecting technology researchers and policymakers, and will include presentations of research from legal, communication, and critical perspectives.