Should online communities require people to create accounts before participating?
This question has been a source of disagreement among people who start or manage online communities for decades. Requiring accounts makes some sense since users contributing without accounts are a common source of vandalism, harassment, and low quality content. In theory, creating an account can deter these kinds of attacks while still making it pretty quick and easy for newcomers to join. Also, an account requirement seems unlikely to affect contributors who already have accounts and are typically the source of most valuable contributions. Creating accounts might even help community members build deeper relationships and commitments to the group in ways that lead them to stick around longer and contribute more.
In a new paper published in Communication Research, Benjamin Mako Hill and Aaron Shaw provide an answer. We analyze data from “natural experiments” that occurred when 136 wikis on Fandom.com started requiring user accounts. Although we find strong evidence that the account requirements deterred low quality contributions, this came at a substantial (and usually hidden) cost: a much larger decrease in high quality contributions. Surprisingly, the cost includes “lost” contributions from community members who had accounts already, but whose activity appears to have been catalyzed by the (often low quality) contributions from those without accounts.
The full citation for the paper is: Hill, Benjamin Mako, and Aaron Shaw. 2020. “The Hidden Costs of Requiring Accounts: Quasi-Experimental Evidence from Peer Production.” Communication Research, 48 (6): 771–95. https://doi.org/10.1177/0093650220910345.
Thinking about applying to graduate school? Wonder what it’s like to pursue a PhD? Interested in understanding relationships between technology and society? Curious about how to do research on online communities like Reddit, Wikipedia, or GNU/Linux? The Community Data Science Collective is hosting a Q&A on November 5th at 13:00 ET / 12:00 CT / 10:00 PT for prospective students. This session is scheduled for an hour, to be divided between a larger group session with faculty and then smaller groups with current graduate students.
This is an opportunity for prospective grad students to meet with CDSC faculty, students, and staff. We’ll be there to answer any questions you have about the group, the work we do, your applications to our various programs, and other topics. You can either submit a question ahead of time or ask one during the session.
About the CDSC
We are an interdisciplinary research group spread across Carleton, Northwestern University, Purdue University, and the University of Washington. (Carleton is not accepting graduate students, though the other universities are.) You can read more about PhD opportunities on our blog.
We are mostly quantitative social scientists pursuing research about the organization of online communities, peer production, online communities, and learning and collaboration in social computing systems. Our group research blog and publications page can tell you more about our work.
Notes About Attending
We are so excited to meet you! Please RSVP online to let us know if you’re coming. This form also gives you the opportunity to ask a question ahead of time. By doing this, we’ll be able to make sure we get to your questions.
We will post another announcement with attendance information. We will also email attendance details to all registered attendees.
The conference will feature two new papers by collective students and faculty that were published in the journal Proceedings of the ACM on Human-Computer Interaction: CSCW.
Information on the talks as well as links to the papers are available here (CSCW members are listed in italics):
In addition, Benjamin Mako Hill is a panel co-chair.
Mako, Sohyeon, Jeremy, and Nathan will all be at the conference and so will tons of our social computing friends. Please come and say “Hello” to any of us and introduce yourself if you don’t already know us :)
Accurately estimating the quality of Wikipedia articles is important task for both researchers and Wikipedia community members. In a forthcoming paper in the Proceedings of the OpenSym 2021, I describe a new method for estimating article quality in Wikipedia in one dimension that builds on the widely used ORES quality model and that improves on the techniques researches have used to incorporate measures of quality into their studies of Wikipedia in the past. I will presenting virtually this week at the OpenSym 2021 conference. OpenSym is free and open to the public this year but requires registration.
Numerous efforts have gone into measuring the quality of Wikipedia articles and the Wikimedia Foundation maintains a machine learning model for measuring article quality on English Wikipedia called the ORES quality model. This model is trained on quality assessments conducted by members of WikiProjects that label articles into hierarchy of quality levels (i.e., stub, start-class, C-class, B-class, Good, Featured) and use boosted decision trees to predict the quality of versions of articles. This model is useful because it can predict the quality of versions of articles that haven’t been assessed. My OpenSym paper (teaser video, full presentation) builds on the ORES quality models to improve measuring Wikipedia article quality in one continuous dimension using ordinal regression models. A 1-D real-valued measure of quality is more granular and easier to use in downstream research. My method also increases the accuracy of quality prediction for units of analysis that are most important for research like articles or revisions and also estimates spacing between different levels of article quality.
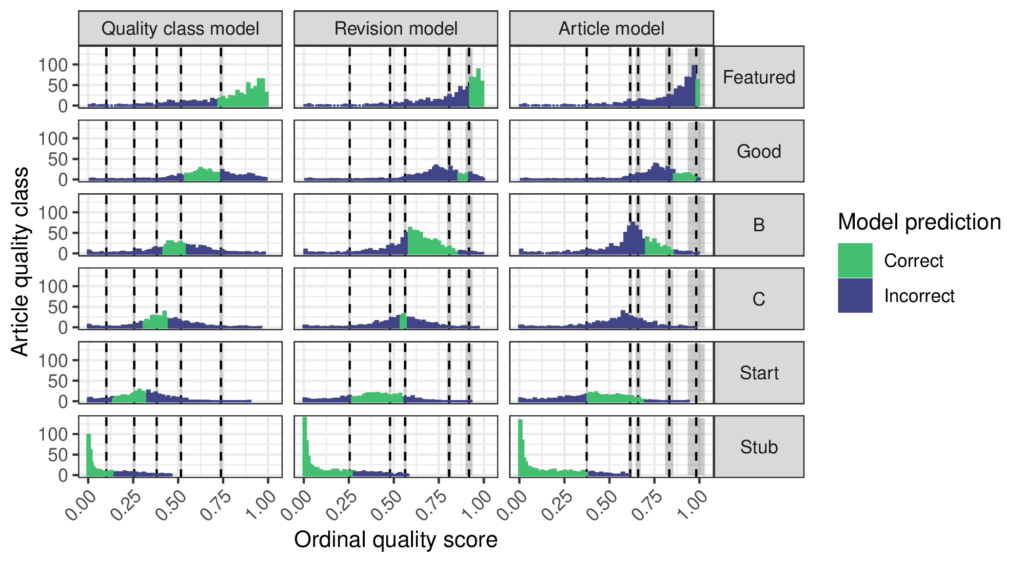
Quality scores and predictions of the ordinal regression models. Columns in the grid of charts correspond to the ordinal quality model calibrated to the indicated unit of analysis and rows correspond to sampled articles having the indicated level of quality as assessed by Wikipedians. Each chart shows the histogram of scores, thresholds inferred by the ordinal model with 95% credible intervals colored in gray, and colors indicating when the model makes correct or incorrect predictions. The thresholds are not evenly spaced, especially in revision model and article model that have more weight on lower quality classes. These two models infer that the gaps between Stub and Start and between Start and C-class articles are considerably wider than the gap between C-class and B-class articles.
An important limitation of the ORES quality models is that they do not output a single real-valued quality score. Instead, they output a multinomial distribution of the probability of an article’s quality class. This means that instead of saying “article X has quality 0.3” the model tells you “the probability of article X’s quality class is 0.1 for stub, 0.2 for start-class, 0.5 for C-class, 0.15 for B-class, 0.05 for Good and 0 for featured and the most probable quality class (MPQC) is C.” Using this kind of output in a downstream statistical analysis is kind of messy. For example, it might seem reasonable to use the MPQC as an integer-valued measure of quality, but this throws away information. Suppose ORES says that “the probability of article Y’s quality class is 0.00 for stub, 0.15 for start-class, 0.5 for C-class, 0.2 for B-class, 0.1 for Good, and 0.05 for Featured” According to the ORES quality model, Y probably has greater quality than X. Even though both have a MPQC of C-class, there’s a much greater change for article Y to be B-class or better than for article X. Is there a way to use the ORES probabilities to build a more granular measure of quality that accounts for this difference?
Aaron Halfaker, one of the creators of the ORES system, combined the probabilities into a 1-D score for one of his research projects by taking a weighed sum of the probabilities and assuming that Wikipedia article quality levels are “evenly spaced.” This creates a score out of the quality class probabilities by multiplying each probability by a weight so that probabilities for higher quality levels get more weight. He chose the weights [0,1,2,3,4,5] so an article gets 0 quality points for being a probable stub, 1 for the probability of being start-class, 2 for C-class, and so on with 5 points for Featured. This results in a nice continuous measure of quality that simplifies downstream statistical analysis. A number of others have followed his lead.
But how reasonable is the “evenly spaced” assumption that supports using the weights [0,1,2,3,4,5]? Could there be a way to pick weights to combine the ORES probabilities without using this assumption? My paper explains why ordinal regression is the right tool for the job and proposes a procedure for fitting an ordinal regression model to a sample representative of a unit of analysis like articles or revisions or quality classes that have been labeled by a WikiProject and scored by the ORES quality model. The ordinal regression predicts the quality labels as a function of the ORES scores and in this way finds a good way to combine the ORES scores into a single value. It also infers threshold parameters that define different regions of the quality score corresponding to quality classes and this allows the “evenly spaced” assumption to be tested. The figure above shows that the article quality levels are not evenly spaced! Interestingly, the way that they are unevenly spaced depends on how quality is measured. If the quality scale is designed to be accurate across all quality classes, then the quality levels are relatively even. However, if it is designed to be accurate for revisions or articles then more of the scale goes to lower levels of quality. Overall, the models agree that the difference between C-class and Start articles is smaller than that between the other levels.
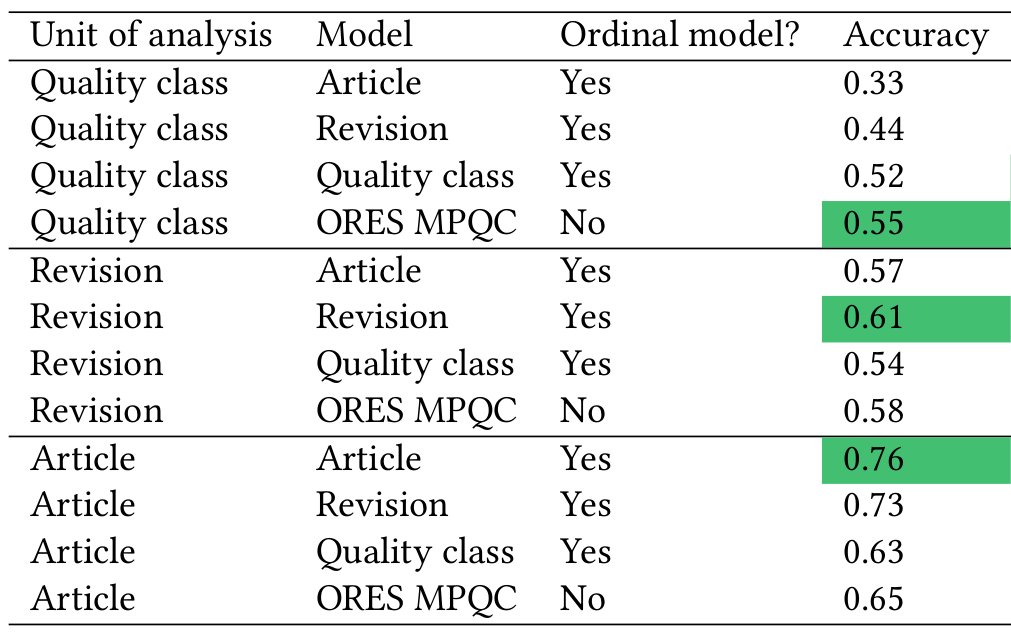
Using the quality scores based on ordinal regression also improves accuracy. This mostly comes from calibrating the ordinal model to the appropriate unit of analysis. The ORES quality model is fit on a “balanced” dataset where each quality class is equally represented. This means that the ORES quality model has learned that each quality class is equally likely to occur in the data. Of course, in reality lower quality articles are far more common than high quality articles. There are over 3,000,000 Stubs on English Wikipedia but less than 8,000 Featured articles. As the table below shows, fitting ordinal models that know the true proportion of each quality class in a sample can improve accuracy compared to the ORES quality model.
Accuracy of quality prediction models depends on the unit of analysis. The greatest accuracy scores are highlighted. Models are more accurate when calibrated on the same unit of analysis on which they are evaluated. Compared to the MPQC, the ordinal quality models have better accuracy when revisions or articles are the unit of analysis. When the quality class is the unit of analysis, the ordinal quality model has slightly worse accuracy.
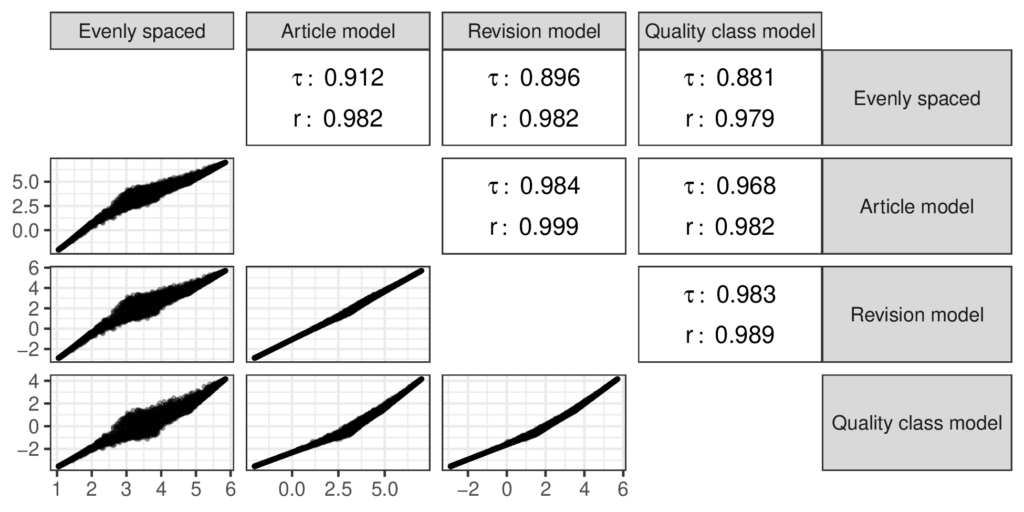
Even though my study has found evidence against the “evenly spaced” assumption, I also found that the quality scores based on it are strongly correlated with the scores from the ordinal model as shown in the figure below. The ‘𝜏’ symbols in the figure stand for the Kendall rank correlation coefficient while the ‘r’ symbols stand for the Pearson correlation coefficient. I used the Kendall correlation because it can capture nonlinear divergences between the measures and the Pearson coefficient is the familiar linear correlation. The “evenly spaced” scores aren’t totally in agreement with the scores from the ordinal models, but they are close enough that I doubt that prior research that used the “evenly spaced” scores to measure quality was mislead by this choice.
Correlations between quality measures show that the different approaches to measuring quality are quite similar. “Evenly spaced” uses the weighted sum of the ORES scores with handpicked coefficients [0,1,2,3,4,5]. Lower values of Kendall’s 𝜏, a nonparametric rank correlation statistic, compared to Pearson’s 𝑟 suggest nonlinear differences between the weighted sum and the other measures.
Conclusions
Measuring article quality in one continuous dimension is a valuable tool for studying the peer production of information goods because it provides granularity and is amenable to statistical analysis. Prior approaches extended ORES article quality prediction into a continuous measure under the “evenly spaced” assumption. I used ordinal regression models to transform the ORES predictions into a continuous measure of quality that is interpretable as a probability distribution over article quality levels, provides an account of its own uncertainty and does not assume that quality levels are “evenly spaced.” Calibrating the models to the chosen unit of analysis improves accuracy for research applications. I recommend that future work adopt this approach when article quality is an independent variable in a statistical analysis.
My paper also has a number of other tidbits about the uncertainty of different quality measures, the importance of feedback between measurement and knowledge in the scientific process and demonstrates model calibration.
A preprint of the paper is available here. The paper has been accepted to OpenSym 2021 and will be presented at the virtual conference on September 17th. A video of the presentation is available here. A dataverse repository containing code and data from the project is available here.
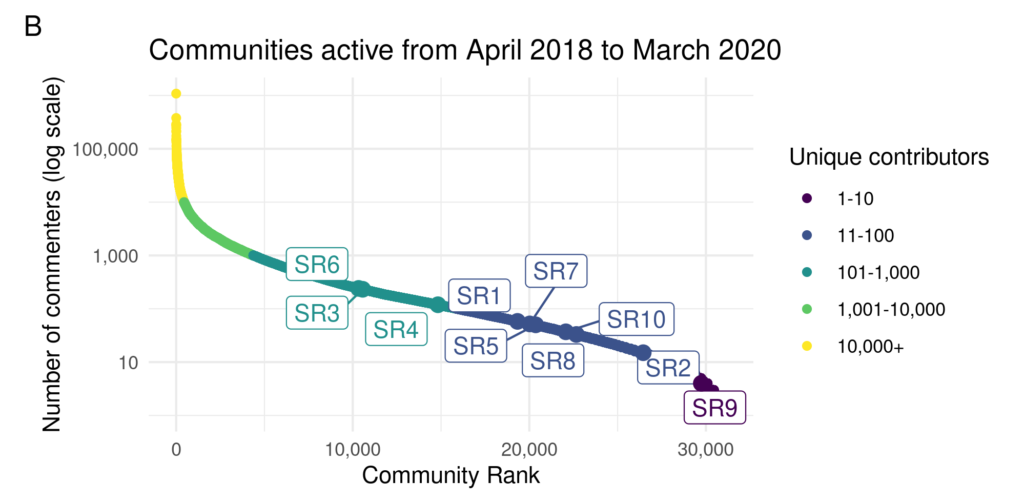
The number of unique commenters who commented on subreddits in March 2020, for subreddits that had at least 1 comment in the each of the previous 23 months. The “SR” communities are those we drew our interview sample from.
When it comes to online communities, we often assume that bigger is better. Large communities can create robust interactions, have access to broad and extensive body of experiences, and provide many opportunities for connections. As a result, small communities are often thought as failed attempts to build big ones. In reality, most online communities are very small and most small communities remain small throughout their lives. If growth and a large number of members are so advantageous, why do small communities not only exist but persist in their smallness?
In a recent research study, we investigated why individuals participate in these persistently small online communities by interviewing twenty participants of small subreddits on Reddit. We asked people about their motivations and explicitly tried to get them to compare their experiences in small subreddits with their experience in larger subreddits. Below we present three of the main things that we discovered through analyzing our conversations.
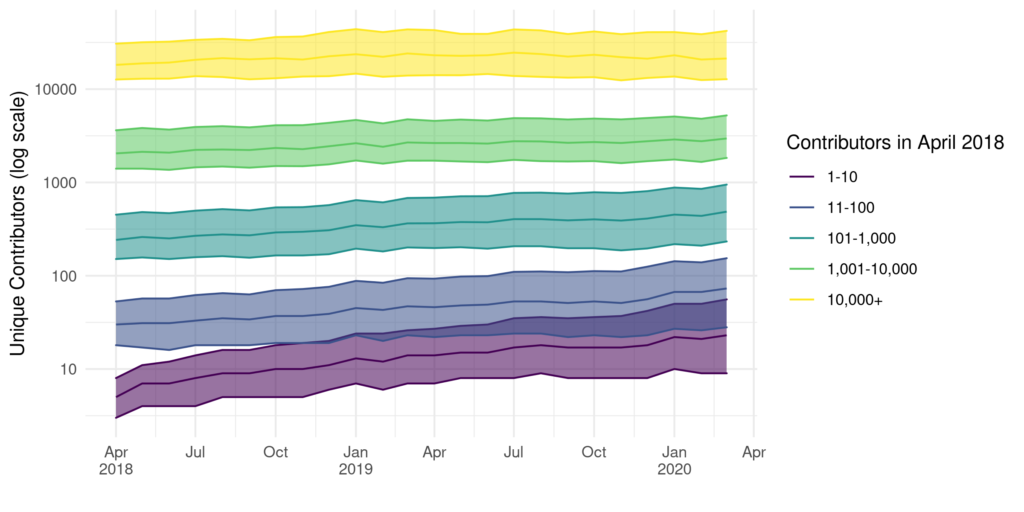
Size of consistently active subreddits over time (i.e., those with at least one comment per month from April 2018 to March 2020). Subreddits are grouped by their size in April 2018. Lines represent the median size each month, and ribbons show the first and third quartiles.
Informational niches
First, we found that participants saw their small communities as unique spaces for information and interaction. Frequently, small communities are narrower versions or direct offshoots of larger communities. For example, the r/python community is about the programming language Python while the r/learnpython community is a smaller community explicitly for newcomers to the language.
By being in a smaller, more specific community, our participants described being able to better anticipate the content, audience, and norms: a specific type of content, people who cared about the narrow topic just like them, and expectations of how to behave online. For example, one participant said:
[…] I can probably make a safe assumption that people there more often than not know what they’re talking about. I’ll definitely be much more specific and not try to water questions down with like, my broader scheme of things—I can get as technical as possible, right? If I were to ask like the same question over at [the larger parent community], I might want to give a little bit background on what I’m trying to do, why I’m trying to do it, you know, other things that I’m using, but [in small community], I can just be like, hey, look, I’m trying to use this algorithm for this one thing. Why should I? Or should I not do it for this?
Curating online experiences
More broadly, participants explained their participation in these small communities as part of an ongoing strategy of curating their online experience. Participants described a complex ecosystem of interrelated communities that the small communities sat within, and how the small communities gave them the ability to select very specific topics, decide who to interact with, and manage content consumption.
In this sense, small communities give individuals a semblance of control on the internet. Given the scale of the internet—and a widespread sense of malaise with online hate, toxicity, and harassment—it is possible that controlling the online experience is more important to users than ever. Because of their small size, these small communities were largely free of the vandals and trolls that plague large online communities, and several participants described their online communities as special spaces to get away from the negativity on the rest of the internet.
Relationships
Finally, one surprise from our research was what we didn’t find. Previous research led us to predict that people would participate in small communities because they would make it easier to develop friendships with other people. Our participants described being interested in the personal experiences of other group members, but not in building individual relationships with them.
Conclusions
Our research shows that small online communities play an important and underappreciated role. At the individual level, online communities help people to have control over their experiences, curating a set of content and users that is predictable and navigable. At the platform level, small communities seem to have a symbiotic relationship with large communities. By breaking up broader topical niches, small communities likely help to keep a larger set of users engaged.
We hope that this paper will encourage others to take seriously the role of small online communities. They are qualitatively different from large communities, and more empirical and theoretical research is needed in order to understand how communities of different sizes operate and interact in community ecosystems.
A preprint of the paper is available here. We’re excited that this paper has been accepted to CSCW2021 and will be published in the Proceedings of the ACM on Human-Computer Interaction and presented at the conference in November. If you have any questions about this research, please feel free to reach out to one of the authors: Sohyeon Hwang or Jeremy Foote.
It’s Ph.D. application season and the Community Data Science Collective is recruiting! As always, we are looking for talented people to join our research group. Applying to one of the Ph.D. programs that the CDSC faculty members are affiliated with is a great way to do that.
This post provides a very brief run-down on the CDSC, the different universities and Ph.D. programs we’re affiliated with, and what we’re looking for when we review Ph.D. applications. It’s close to the deadline for some of our programs, but we hope this post will still be useful to prospective applicants now and in the future.
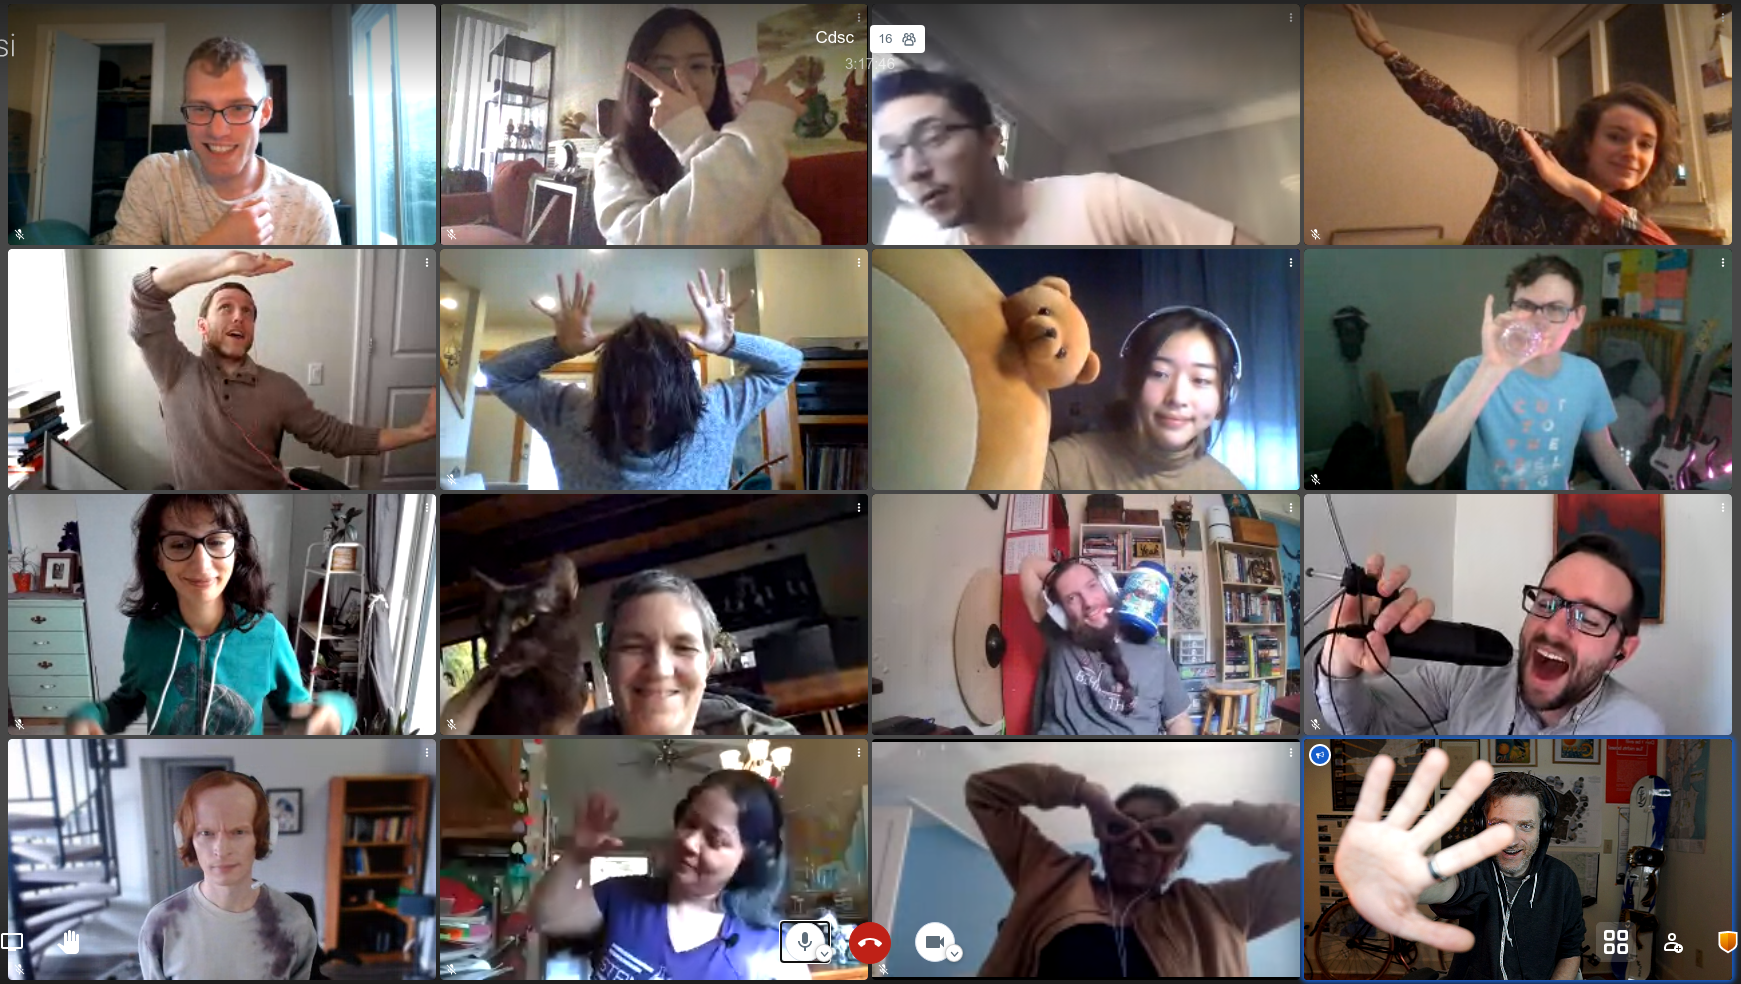
Group photo of the collective at a recent virtual retreat.
What are these different Ph.D. programs? Why would I choose one over the other?
This year the group includes four faculty principal investigators (PIs) who are actively recruiting PhD students: Aaron Shaw (Northwestern University), Benjamin Mako Hill and Sayamindu Dasgupta (University of Washington in Seattle), and Jeremy Foote (Purdue University). Each of these PIs advise Ph.D. students in Ph.D. programs at their respective universities. Our programs are each described below.
Although we often work together on research and serve as co-advisors to students in each others’ projects, each faculty person has specific areas of expertise and interests. The reasons you might choose to apply to one Ph.D. program or to work with a specific faculty member could include factors like your previous training, career goals, and the alignment of your specific research interests with our respective skills.
At the same time, a great thing about the CDSC is that we all collaborate and regularly co-advise students across our respective campuses, so the choice to apply to or attend one program does not prevent you from accessing the expertise of our whole group. But please keep in mind that our different Ph.D. programs have different application deadlines, requirements, and procedures!
Who is actively recruiting this year?
Given the disruptions and uncertainties associated with the COVID19 pandemic, the faculty PIs are more constrained in terms of whether and how they can accept new students this year. If you are interested in applying to any of the programs, we strongly encourage you to reach out the specific faculty in that program before submitting an application.
Aaron Shaw is an Associate Professor in the Department of Communication Studies at Northwestern. In terms of Ph.D. programs, Aaron’s primary affiliations are with the Media, Technology and Society (MTS) and the Technology and Social Behavior (TSB) Ph.D. programs. Aaron also has a courtesy appointment in the Sociology Department at Northwestern, but he has not directly supervised any Ph.D. advisees in that department (yet). Aaron’s current research projects focus on comparative analysis of the organization of peer production communities and social computing projects, participation inequalities in online communities, and empirical research methods.
Jeremy Foote
Jeremy Foote is an Assistant Professor at the Brian Lamb School of Communication at Purdue University. He is affiliated with the Organizational Communication and Media, Technology, and Society programs. Jeremy’s current research focuses on how individuals decide when and in what ways to contribute to online communities, how communities change the people who participate in them, and how both of those processes can help us to understand which things become popular and influential. Most of his research is done using data science methods and agent-based simulations.
What do you look for in Ph.D. applicants?
There’s no easy or singular answer to this. In general, we look for curious, intelligent people driven to develop original research projects that advance scientific and practical understanding of topics that intersect with any of our collective research interests.
To get an idea of the interests and experiences present in the group, read our respective bios and CVs (follow the links above to our personal websites). Specific skills that we and our students tend to use on a regular basis include experience consuming and producing social science and/or social computing (human-computer interaction) research; applied statistics and statistical computing, various empirical research methods, social theory and cultural studies, and more.
Formal qualifications that speak to similar skills and show up in your resume, transcripts, or work history are great, but we are much more interested in your capacity to learn, think, write, analyze, and/or code effectively than in your credentials, test scores, grades, or previous affiliations. It’s graduate school and we do not expect you to show up knowing how to do all the things already.
Intellectual creativity, persistence, and a willingness to acquire new skills and problem-solve matter a lot. We think doctoral education is less about executing a task that someone else hands you and more about learning how to identify a new, important problem; develop an appropriate approach to solving it; and explain all of the above and why it matters so that other people can learn from you in the future. Evidence that you can or at least want to do these things is critical. Indications that you can also play well with others and would make a generous, friendly colleague are really important too.
All of this is to say, we do not have any one trait or skill set we look for in prospective students. We strive to be inclusive along every possible dimension. Each person who has joined our group has contributed unique skills and experiences as well as their own personal interests. We want our future students and colleagues to do the same.
Now what?
Still not sure whether or how your interests might fit with the group? Still have questions? Still reading and just don’t want to stop? Follow the links above for more information. Feel free to send at least one of us an email. We are happy to try to answer your questions and always eager to chat.
Debian is one of the oldest, largest, and most influential peer production communities and has produced an operating system used by millions for over the last three decades. DebConf is that community’s annual meeting. This year, the Community Data Science Collective was out in force at Debian’s virtual conference to present several Debian-focused research projects that we’ve been working on.
First, Wm Salt Hale presented work from his master thesis project on “Resilience in FLOSS: Do founder decisions impact development activity after crisis events?” His work tried to understand the social dynamics behind organizational resilience among free software projects based on what Salt calls “founder decisions.” He did so by estimating the relationship between changes in developer activity after security bugs and testing several theories about how this relationship might vary between permissive and copyleft licensed software packages.
Workshop Report From Connected Learning Summit 2021
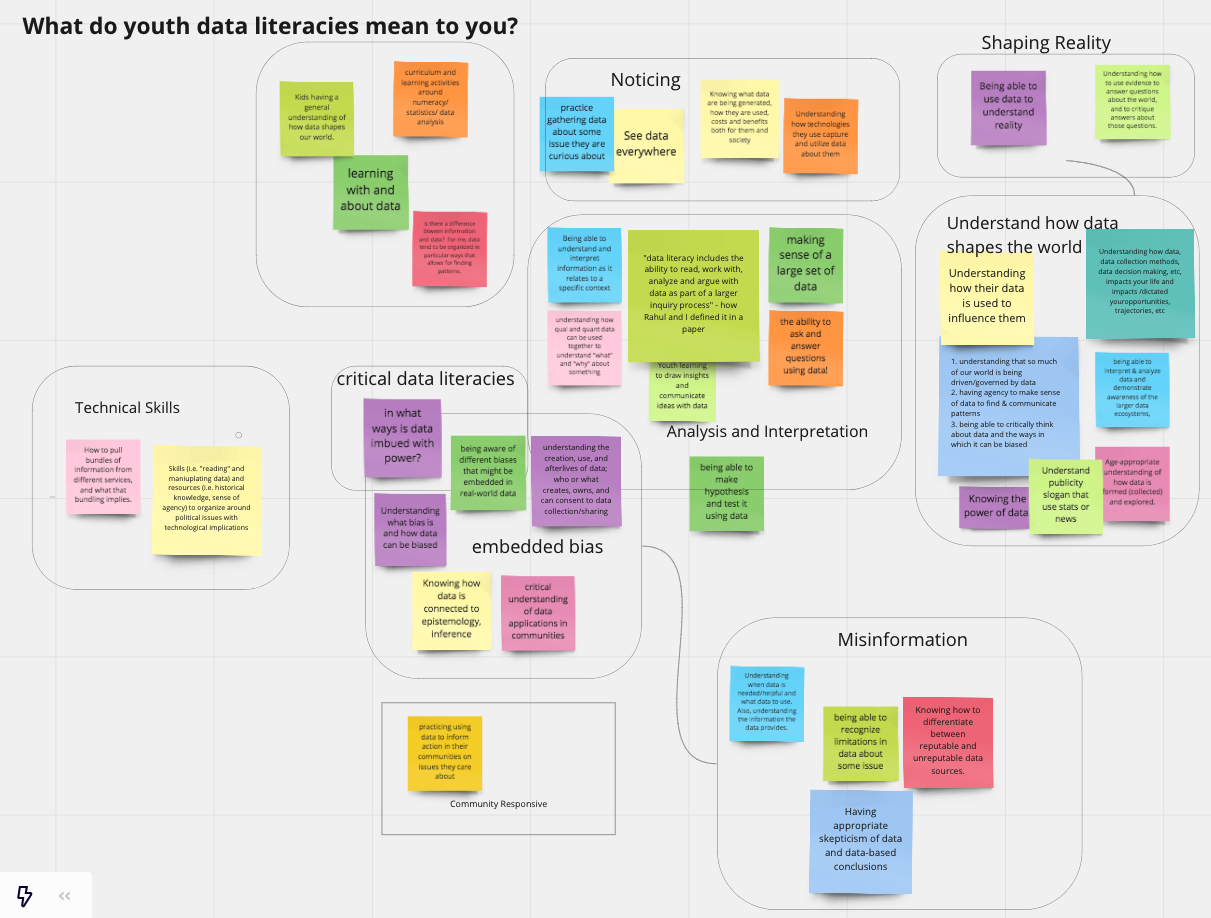
What are data literacies? What should they be? How can we best support youth in developing them via future tools? On July 13th and July 15th 2021, we held a two-day workshop at the Connected Learning Summit to explore these questions. Over the course of two very-full one-hour sessions, 40 participants from a range of backgrounds got to know each other, shared their knowledge and expertise, and engaged in brainstorming to identify important pressing questions around youth data literacies as well as promising ways to design future tools to support youth in developing them. In this blog post, we provide a full report from our workshop, links to the notes and boards we created during the workshop, and a description of how anyone can get involved in the community around youth data literacies that we have begun to build.
Caption: We opened our sessions by encouraging participants to share and synthesize what youth data literacies meant to them. This affinity diagram is the result.
How this workshop came to be
As part of the research team interested in research about learning at the Community Data Science Collective, we have long been fascinated with how youth and adults learn how to ask and answer questions with data While we have engaged with these questions ourselves by looking to Scratch and Cognimates, we are always curious about how we might design tools to promote youth data literacies in the future in other contexts.
The Connected Learning Summit is a unique gathering of practitioners, researchers, teachers, educators, industry professionals, and others, all interested in formal and informal learning and the impact of new media on current and future communities of learners. When the Connected Learning Summit put up a call for workshops, we thought this was a great opportunity to engage the broader community on the topic of youth data literacies.
Several months ago, the four of us (Stefania, Regina, Emilia and Mako) started to brainstorm ideas for potential proposals. We started by listing potential aspects and elements of data literacies such as: finding & curating data, visualizing & analyzing it, programming with data, and engaging in critical reflection. We then started to identify tools that can be used to accomplish each goal and tied to identify opportunities and gaps. See some examples of these tools on our workshop website.
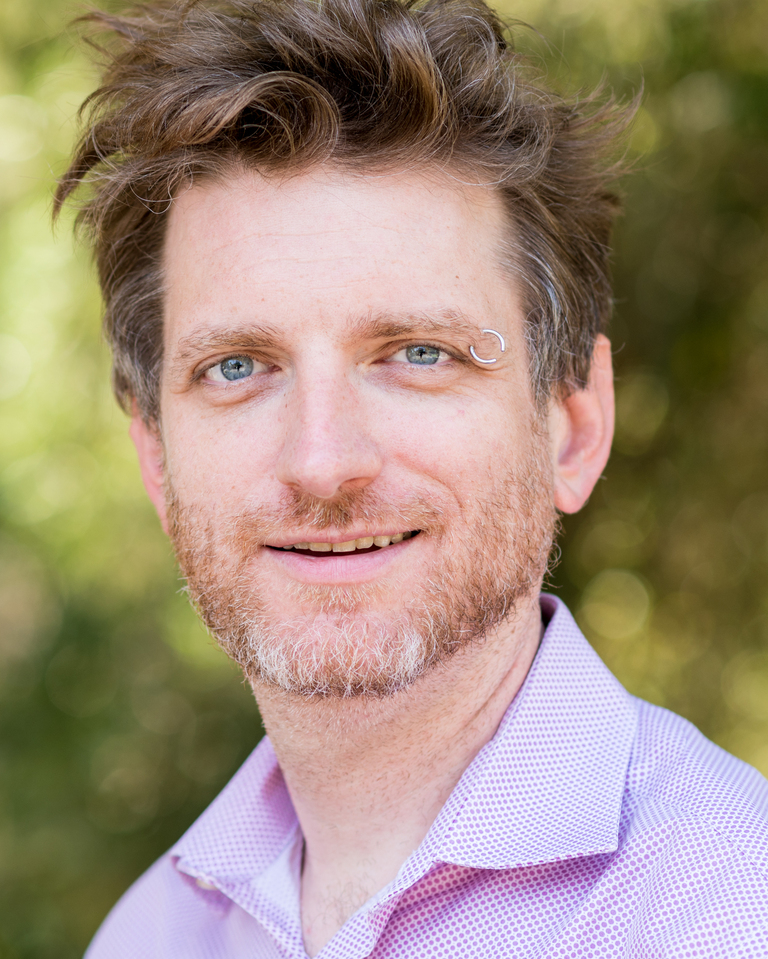
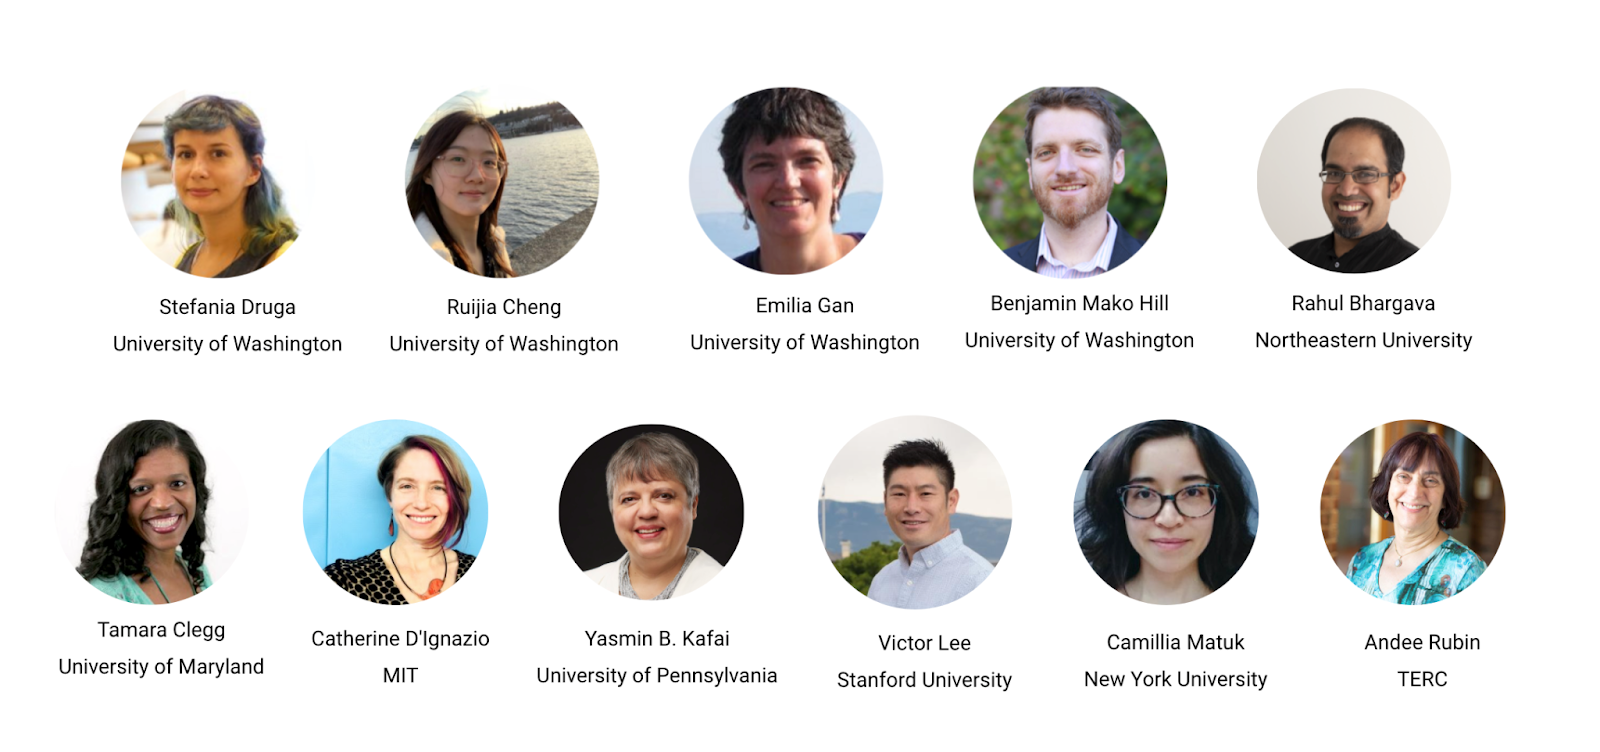
As part of this process, we identified a number of leaders in the space. This included people who have built tools like Rahul Bhargava and Catherine D’Ignazio who designed Databasic.io,Andee Rubinwho contributed to CODAP, and Victor Lee who focused on tools that link personal informatics and data. Other leaders included scholars who researched how existing tools are being used to support data literacies, including Tammy Clegg who has researched how college athletes develop data literacy skills, Yasmin Kafai who has looked at e-textile projects, and Camillia Matuk who has done research on data literacy curricula. Happily, all of these leaders agreed to join us as co-organizers for the workshop.
The workshop and what we learned from it
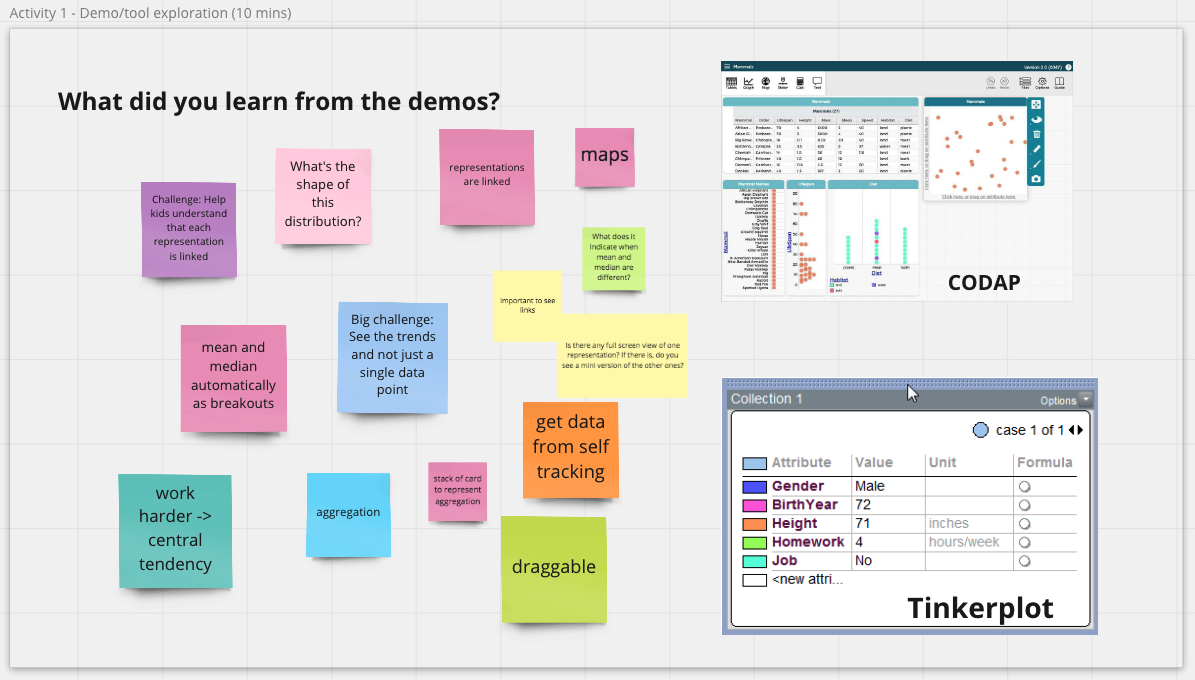
Our workshop took place on July 13th and July 15th as part of the 2021 Connected Learning Summit. Participants came from diverse backgrounds and the group included academic researchers, industry practitioners, K-12 teachers, and librarians. On the first day we focused on exploring existing learning scenarios designed to promote youth data literacies. On the second day we built on big questions raised in the initial session and brainstormed features for future systems. Both workshop sessions were composed of several breakout sessions. We took notes in a shared editor and encouraged participants to add their ideas and comments on sticky notes on collaborative digital white boards and share their definitions and questions around data literacies.
Caption: organizers and participants sharing past projects and ideas in a breakout session.
Day 1 Highlights
On Day 1, we explored a variety of existing tools designed to promote youth data literacies. We had a total of 28 participants who attended the session. We began with a group exercise where we shared their own definitions of youth data literacies before dividing into 3 groups: a group focusing on tools for data visualization and storytelling, a group focusing on block-based tools, and a group focusing on data literacy curricula. In each breakout session, our co-organizers first demonstrated one or two existing tools. Each group then discussed how the demo tool might support a single learning scenario based on the following prompt: “Imagine a six-grader who just learned basic concepts about central tendency, how might she use these tools to apply this concept on real world data?” Each group generated many reflective questions and ideas that would prompt and help inform the design of future data literacies tools. Results of our process are captured in the boards linked below.
Caption: Activities on Miro boards during the workshop.
Data visualization and storytelling
Click here to see the activities on Miro board for this breakout session.
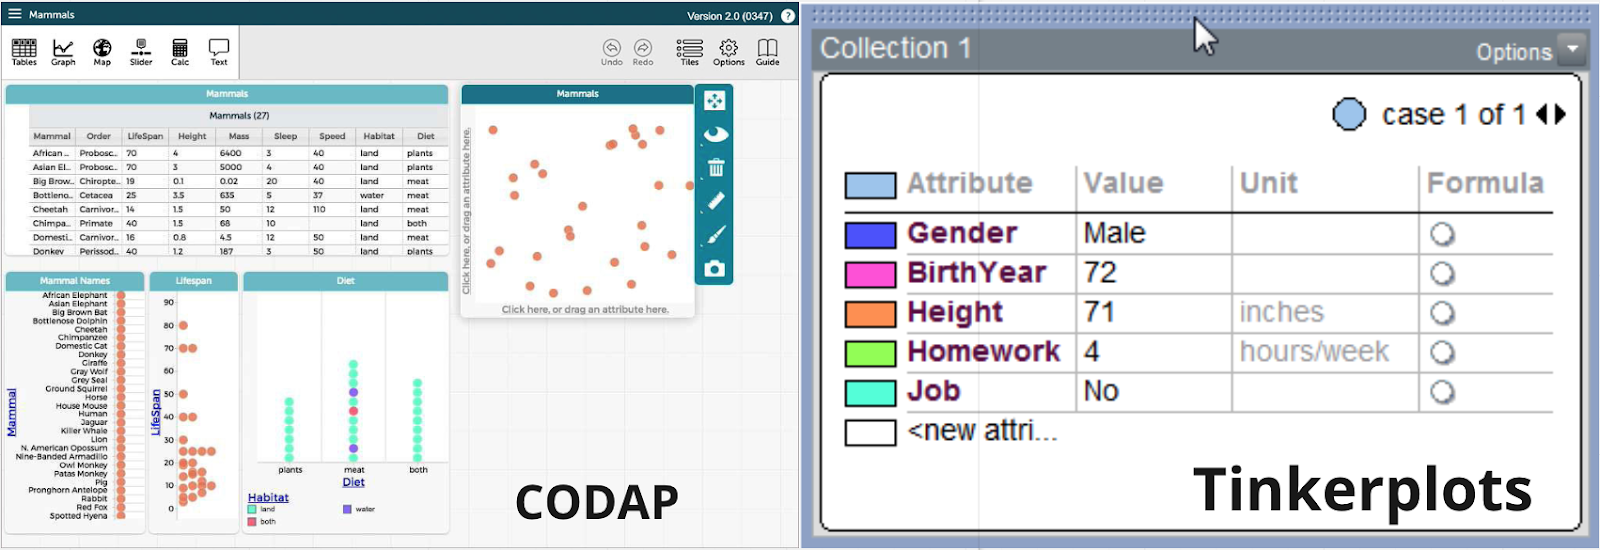
In the sub-section focusing on data visualization and storytelling, Victor Lee first demonstrated Tinkerplots, a desktop-based software that allows students to explore a variety of visualizations with simple click-button interaction using data in .csv format. Andee Rubin then demonstrated CODAP, a web-based tool similar to Tinkerplots that supports drag-and-drop with data, additional visual representation options including maps, and connection between representations.
Caption: CODAP and Tinkerplots—two tools demonstrated during the workshop.
We discussed how various features of these tools could support youth data literacies in specific learning scenarios. We saw flexibility as one of the most important factors in tool use, both for learners and teachers. Both tools are topic-agnostic and compatible with any data in .csv format. This allows students to explore data of any topics that interest them. Simplicity in interaction is another important advantage. Students can easily see the links between tabular data and visualizations and try out different representations using simple interactions like drag-and-drop, check boxes, and button clicks. Features of these tools can also support students in performing aggregation on data and telling stories about trends and outliers.
We further discussed potential learning needs beyond what the current features could support. Before creating visualizations, students may need scaffolds during the process of data collection, as well as in the stage of programming with and preprocessing data. Story telling about the process of working with data was another theme that came up a lot from our discussion. Open questions include how features can be designed to support reproducibility, how we can design scaffolds for students to explain what they are doing with data in diary style stories, and how we can help students narrate what they think about a dataset and why they generate particular visualizations.
Block-based tools
Click here to see the activities on Miro board for this breakout session.
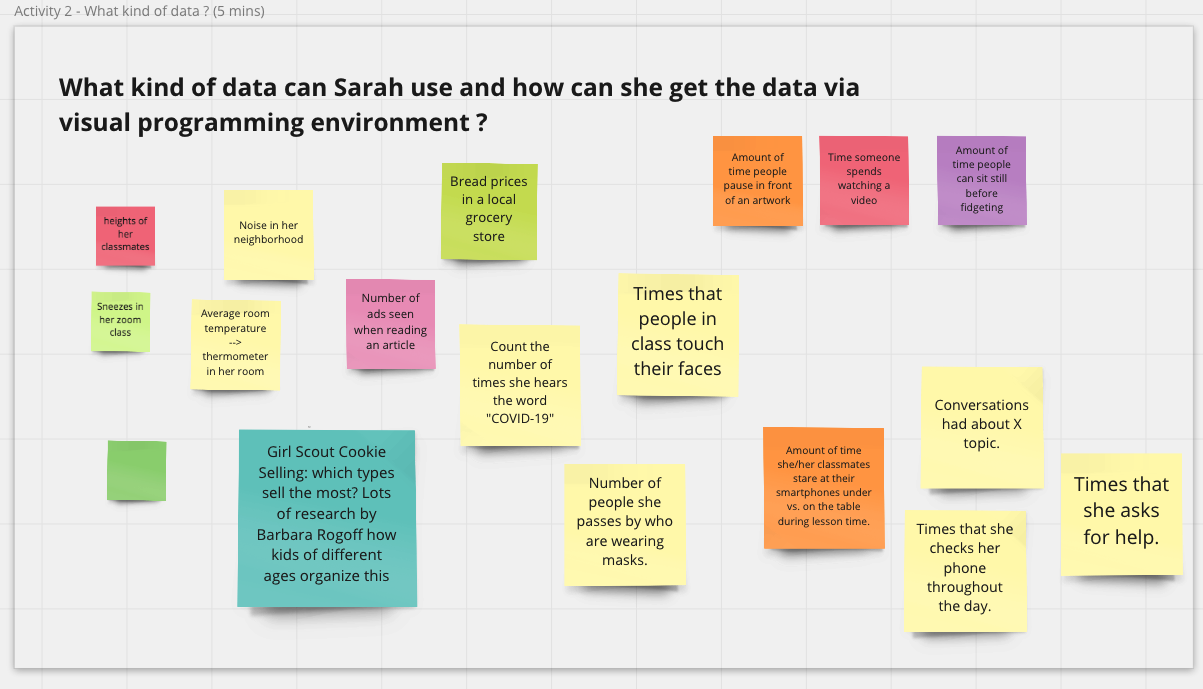
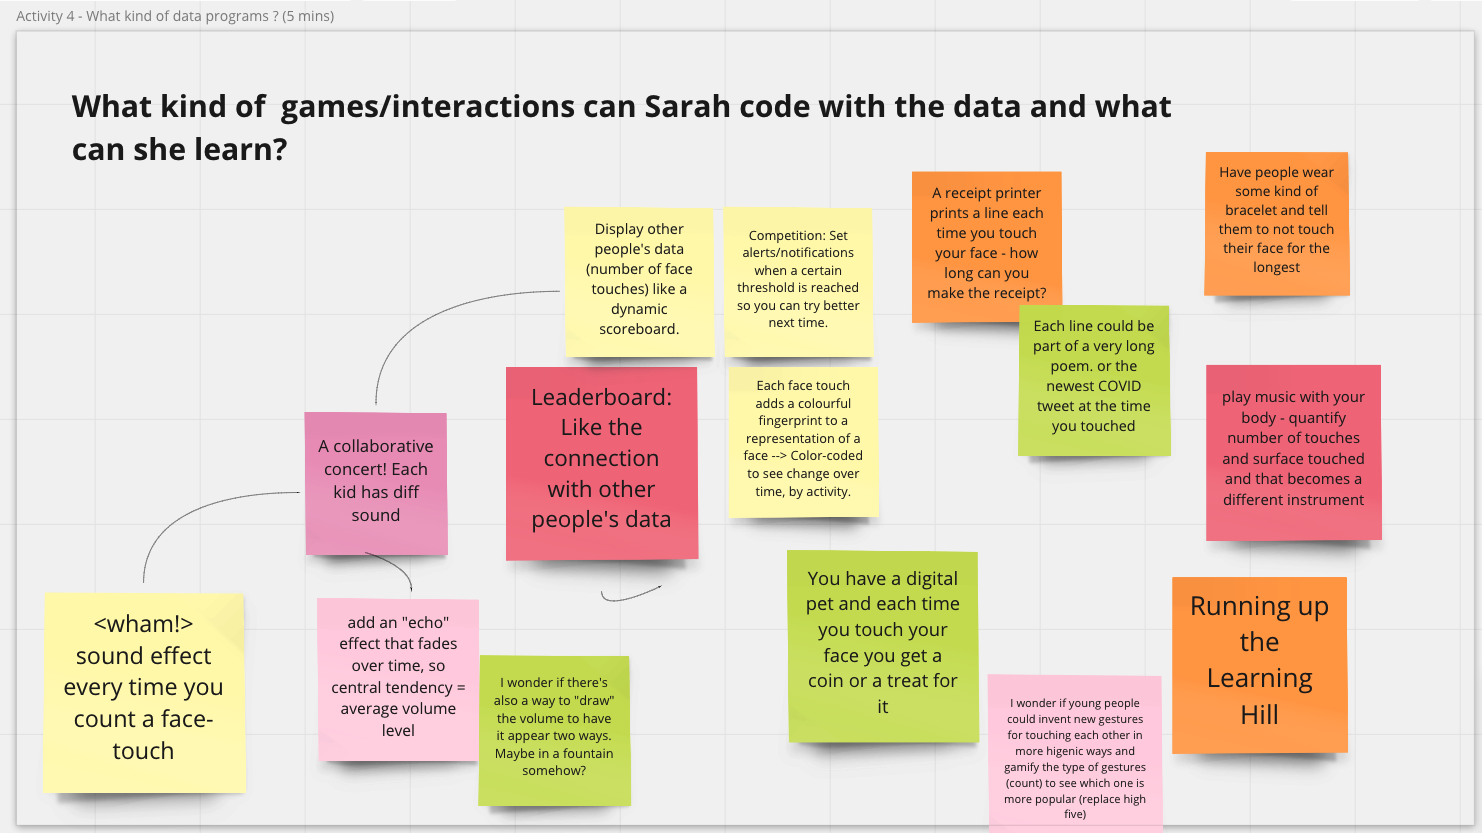
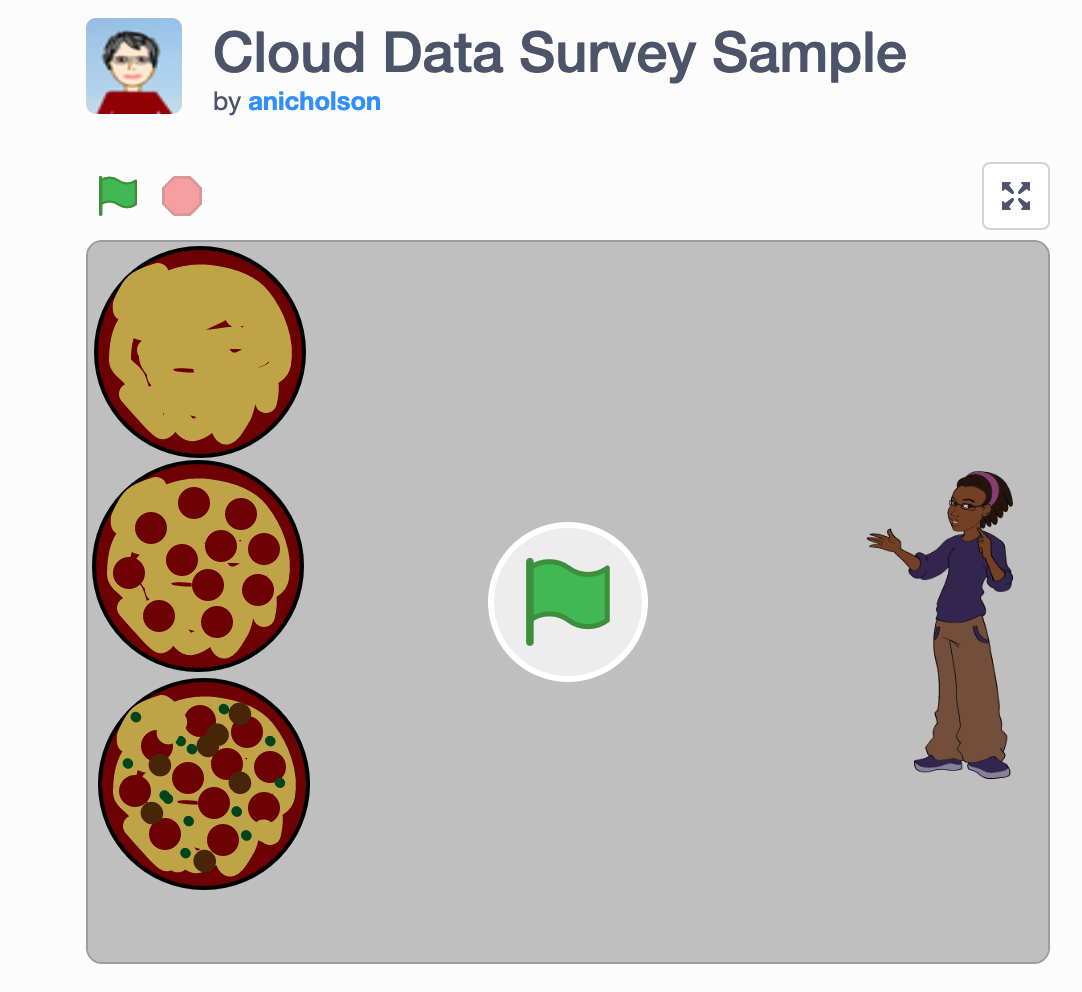
The breakout section about block-based tools started with PhD candidate Stefania Druga demonstrating a program in Scratch and how users could interact with data using the Scratch Cloud Data. We brainstormed about the kind of data students could collect and explore and the kind of visualization, game-based, or other creative interactions youth could create with the help of block-based tools. As a group, we came up with many creative ideas. For example, students can collect and visualize “the newest COVID tweet at the time you touched” a sensor and make “sound effect every time you count a face-touch.”
Caption: A Scratch project demonstrated during the workshop made with Cloud Data.
We discussed how interaction with data was part of an enterprise that is larger than any particular digital scaffold. After all, data exploration is embedded in social context and might reflect hot topics and recent trends. For instance, many of our ideas about data explorations were around COVID-19 related data and topics.
Our group also felt that interaction with data should not be limited to a single digital software. Many scenarios we came up with were centered on personal data collection in physical spaces (e.g., counting the number of times a student touches their own face). This points to a future design direction of how we can connect multiple tools that support interaction in both digital and physical spaces and encourage students to explore questions using different tools.
A final theme from our discussion was around how we can use block-based tools to allow engagement with data among a wider audience. For example, accessible and interesting activities and experience with block-based tools could be designed so that librarians can get involved in meaningful ways to introduce people to data.
Data literacy curriculum
Click here to see the activities on Miro board for this breakout session.
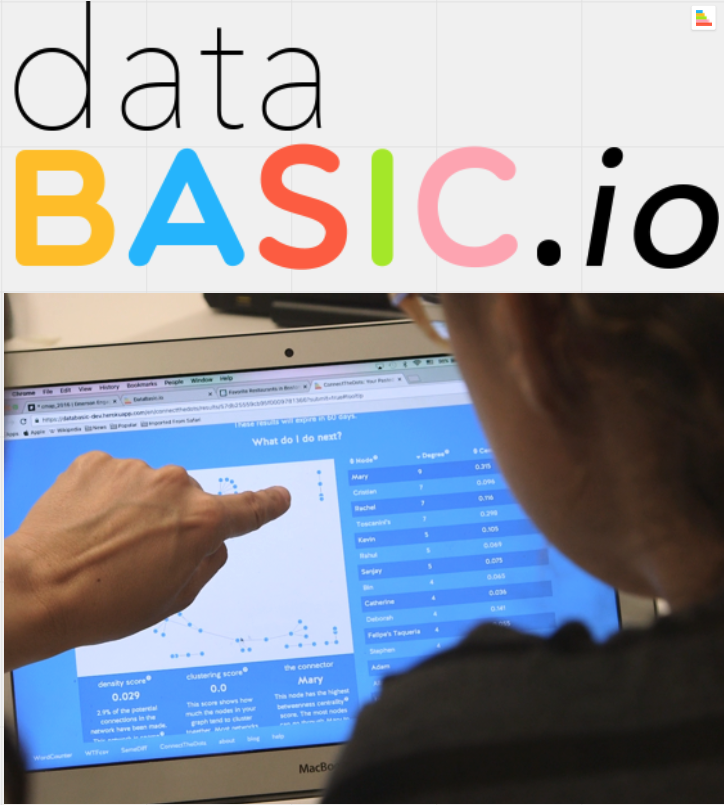
In the breakout section emphasizing on curriculum design, we started with an introduction by Catherine D’Ignazio and Rahul Bhargava on DataBasic.io’s Word Counter: a tool that allows users to paste in text to see word counts in various ways. We also walked through some curricula that the team created to guide students through the process of telling stories with data.
We talked about how this design was powerful in that it allows students to bring their own data and context, and to share knowledge about what they expect to find. Some of the scenarios we imagined included students analyzing their own writings, favorite songs, and favorite texts, and how they might use data to tell personalized stories from there. The specificity of the task supported by the tool enables students to deepen concepts about data by asking specific questions and looking at different datasets to explore the same question.
Caption: dataBASIC.io helps users explore data.
We also reflected on the fact that tools provided in Databasic.io are easy to use precisely because they are quite narrowly focused on a specific analytic task. This is a major strength of the tools, as they are intended as transitional bridges to help users develop foundational skills for data analysis. Using these tools should help answer questions, but should also encourage users to ask even more.
This led to a new set of issues discussed during the breakout session: How do we chain collections of small tools that might serve as one part of a data literacies pipeline together? This is where we felt curricular design could really come into play. Rather than having tools that try to “be everything,” using well-designed tools that address one aspect of an analysis can provide more flexibility and freedom to explore. Our group felt that curriculum can help learners reach the most important step in their learning, going from data to story to the bigger world—and to understanding why the data might matter.
Day 2 Highlights
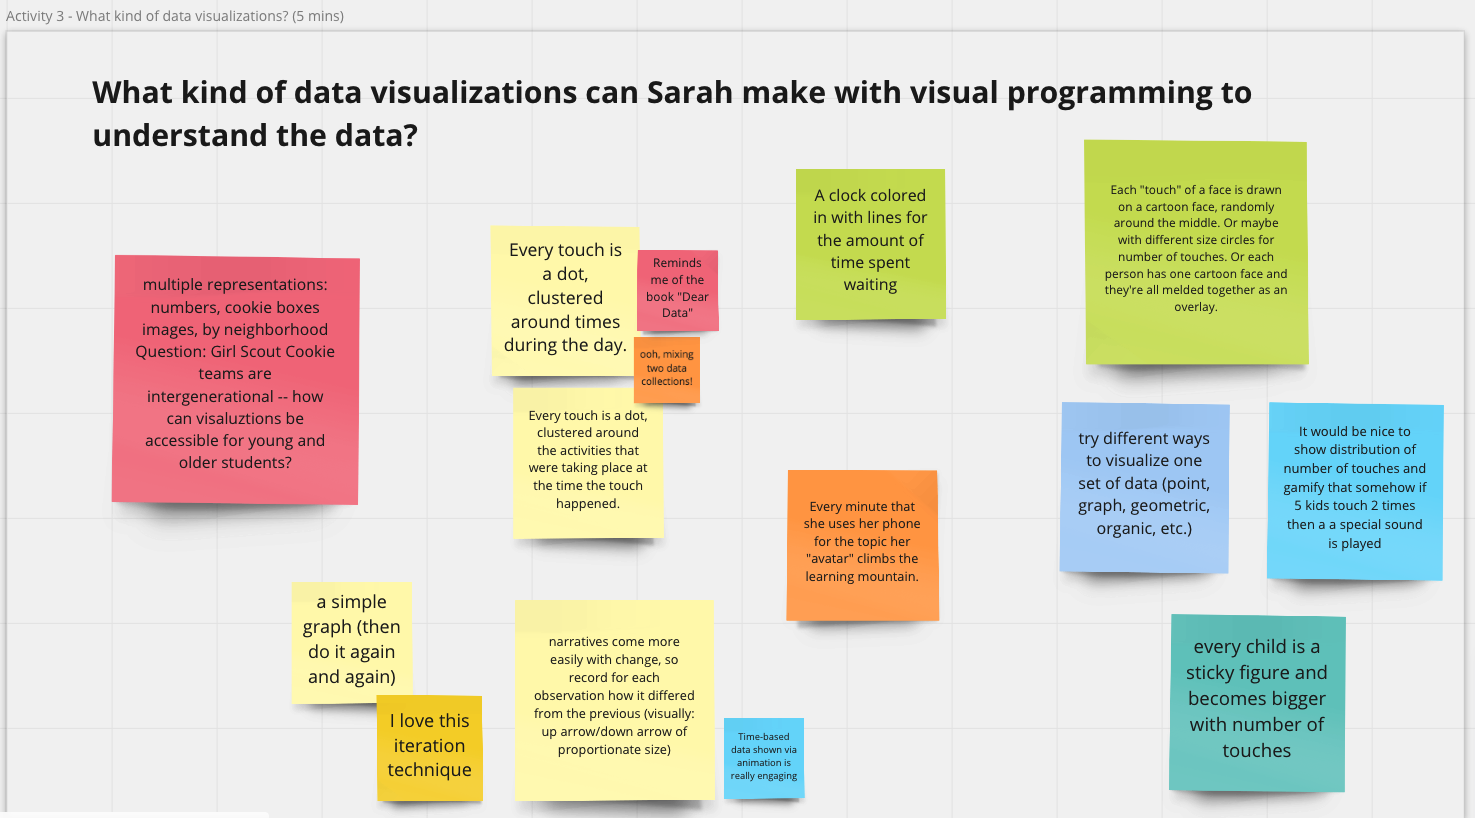
The goal for the Day 2 of our workshop was to speculate and brainstorm future designs of tools that support youth data literacies. After our tool exploration and discussions on Day 1, three interesting brainstorming questions emerged across the breakout sections described above:
How can we close the gap between general purpose tools and specific learning goals?
How can we support storytelling using data?
How can we support insights into the messiness of data and hidden decisions
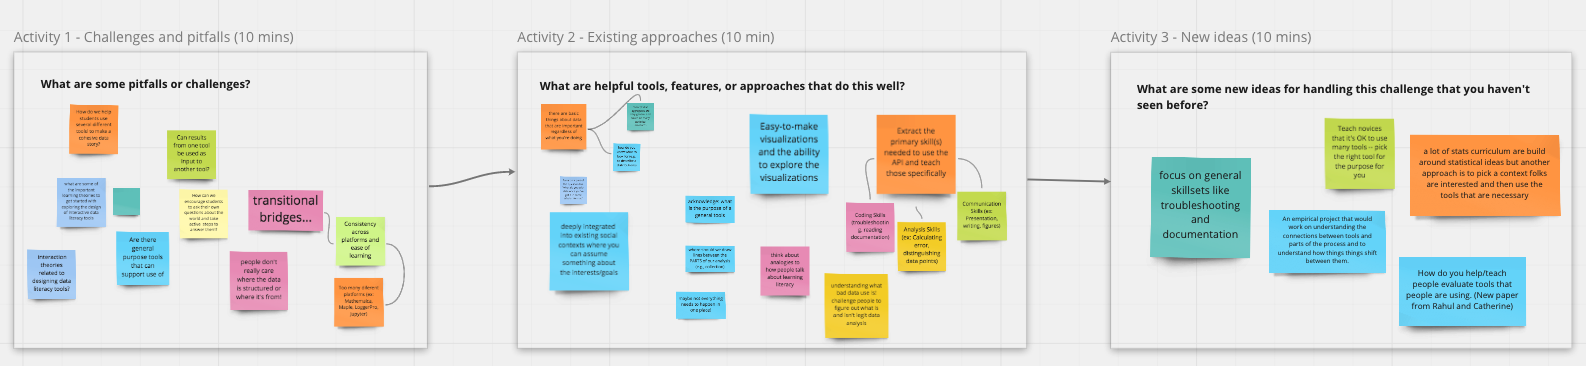
We focused on discussing these questions on Day 2. A total of 29 participants attended and we once again divided into breakout groups based on the three questions above. For each brainstorming question, we considered the key questions in terms of the following three sub-questions: What are some helpful tools or features that can help answer the question? What are some pitfalls? And what new ideas can we come up with?
Caption: Workshop activities generated an abundance of ideas.
How can we close the gap between general purpose tools and specific learning goals?
Click here to see the activities on Miro board for this breakout session.
Often tools designed to solve a range of potential problems. That said, learners attempting to engage in data analysis are frequently faced with extremely specific questions about their analysis and datasets. Where does their data come from? How is it structured? How can it be collected? How do we balance the desire to serve many specific learners’ goals with general tools against the desire to handle specific challenges well?
As one approach, we drew lines between different parts of doing data analysis and frequently required features in different tools. Of course, data analysis is rarely a simple linear process. We also concluded that perhaps not everything needs to happen in one place or with one tool, and that this should be acknowledged and considered during the design process. We also discussed the importance of providing context within more general data analytic tools. We also talked about how learners need to think about the purpose of their analysis before they consider what tool to use and how, ideally, youth would learn to see patterns in data and to understand the significance of the patterns they find. Finally, we agreed that tools that help students understand the limitations of data and the uncertainty inherent in the data are also important.
Challenges and opportunities for telling stories with data
Click here to see the activities on Miro board for this breakout session.
In this section, we discussed challenges and opportunities around supporting students to tell stories with data. We talked about enabling students to recognize and represent the backstory of data. Open questions included: How do we make sure learners are aware of bias? And how can we help people recognize and document the decision of what to include and exclude?
As for telling stories about students’ own experience of working with data, collaboration was also a topic that came up frequently. We agreed that narrative with data is never an individual process. We discussed that future tools should be designed to support critique, iteration, and collaboration among storytellers, audiences, and maybe also between tellers and audiences.
Finally, we talked about future directions. This included taking a crowdsourced, community-driven approach to tell stories with data. We also noted that we had seen a lot of research effort to support storytelling about data in visualization systems or computational notebooks. We agreed that storytelling should not be limited to digital format and speculated that future designs could extend the storytelling process to unplugged, physical activities. For example, we can design to encourage students to create artefacts and monuments as part of the data storytelling process. We also talked about designing to engage people from diverse backgrounds and communities to contribute to and explore data together.
Challenges and opportunities for helping students to understand the messiness of data
Click here to see the activities on Miro board for this breakout session.
In this section, we talked about the tension between the need to make data clean and easy to use for students and the need to let youth understand the messiness of real world data. We shared our own experiences helping students engage with real or realistic data. A common way is to engage students in collaborative data production and have them compare the outcomes of a similar analysis between each other. For instance, students can document their weekly groceries and find that different people record the same items under different names. They can then come up with a plan to name things consistently and clean their data.
One very interesting point that came up from our discussion was what we really mean by “messy data.” “Messy,” incomplete, or inconsistent data may be unusable for computers while still comprehensible by humans. Therefore to be able to work with messy data does not only mean to have the skills to preprocess, but also involve the recognition of hidden human decisions and assumptions.
We came up with many ideas regarding future system design. We suggested designing to support crowdsourced data storytelling. For example, students can each contribute a small piece of documentation about the background of a dataset. Features might also be designed to support students to collect and represent the backstory of data in innovative ways. For example, functions that support the generation of rich media, such as videos, drawings, journal entries, can be embedded into data representation systems. We might also innovate on the way we design the interface of data storage so that students can interact with rich background information and metadata while still keeping the data “clean” for computation.
Next steps & community
We intend for this workshop to be only the beginning of our learning and exploration in the space of youth data literacies. We also hope to continue building the community we built. In particular, we have started a mailing list where we can continue our ongoing discussion. Please feel free to add yourself to the mailing list if you would like to be kept informed about our ongoing activities.
Although the workshop has ended, we have included links to many resources on the workshop website, and we invite you to explore the site. We also encourage you to contribute to a crowdsourced list of papers on data literacies by filling out this form.
This blog was collaboratively written by Regina Cheng, Stefania Druga, Emilia Gan, and Benjamin Mako Hill.
Stefania Druga is a PhD candidate in the Information School at University of Washington. Her research centers on AI literacy for families and designing tools for interest-based creative coding. In her most recent project, she focuses on building a platform that leverages youth creative confidence via coding with AI agents.
Regina Cheng is a PhD candidate in the Human Centered Design and Engineering department at University of Washington. Her research centers on broadening and facilitating participation in online informal learning communities. In her most recent work, she focuses on designing for novices’ engagement with data in online communities.
Emilia Gan is a graduate student in the Paul G. Allen School of Computer Science and Engineering (UW-Seattle). Her research explores factors that lead to continued participation of novices in computing.
Benjamin Mako Hill is an Assistant Professor at UW. His research involves democratizing data science—and doing it from time to time as well.
User-generated content on the Internet provides the basis for some of the most popular websites, such as Wikipedia, crowdsourced question-and-answer sites like Stack Overflow, video-sharing sites like YouTube, and social media platforms like Reddit. Much (or in some cases all) of the content on these sites is created by unpaid volunteers, who invest substantial time and effort to produce high quality information resources. So are these volunteers and content contributors more generous in general than people who don’t contribute their time, knowledge, or information online?
We (Floor Fiers, Aaron Shaw, and Eszter Hargittai) consider this question in a recent paper published in The Journal of Quantitative Description: Digital Media (JQD:DM). The publication of this particularly is exciting because it pursues a new angle on these questions, and also because it’s part of the inaugural issue of JQD:DM, a new open-access venue for research that seeks to advance descriptive (as opposed to analytic or causal) knowledge about digital media.
The study uses data from a national survey of U.S. adult internet users that includes questions about many kinds of online contribution activities, various demographic and background attributes, as well as a dictator game to measure generosity. In the dictator game, each participant has an opportunity to make an anonymous donation of some unanticipated funds to another participant in the study. Prior experimental research across the social sciences has used dictator games, but no studies we know of had compared dictator game donations with online content contributions.
Sharing content. GotCredit via flickr.
Overall, we find that people who contribute some kind of content online exhibit more generosity in the dictator game. More specifically, we find that people producing any type of user-generated content tend to donate more in the dictator game than those who do not produce any such content. We also disaggregate the analysis by type of content contribution and find that donating in the dictator game only correlates with content contribution for those who write reviews, upload public videos, pose or answer questions, and contribute to encyclopedic knowledge collections.
So, generous attitudes and behaviors may help explain contributions to some types of user-generated content, but not others. This implies that user-generated content is not a homogeneous activity, since variations exist between different types of content contribution.
The (open access!) paper has many more details, so we hope you’ll download, read, and cite it. Please feel free to leave a comment below too.
Paper Citation: Fiers, Floor, Aaron Shaw, and Eszter Hargittai. 2021. “Generous Attitudes and Online Participation”. Journal of Quantitative Description: Digital Media 1 (April). https://doi.org/10.51685/jqd.2021.008.