Kaylea to present at ‘Women in Data Science’ Conference

Women in Data Science Puget Sound is part of a 50+-country conference series founded and organized in cooperation with Stanford University’s Data Science coalition. Anyone may attend, regardless of gender: events feature a speaker lineup composed of women in data science. The Puget Sound event is Tuesday, April 25 at the Expedia HQ in Seattle, and numerous affiliated regional and online events are scheduled in the coming weeks.

If you’re in the Seattle area, you might like to catch CDSC member Kaylea presenting a workshop! Here’s the pitch for attending her beginner-friendly session:

Let’s Re-think Political Bias & Build Our Own Classifier

How can we think about political bias without falling into assumptions about who's on what side and what that means?

Data science and ML offer us an alternative: we can parse political speech about a topic and use NLP/ML techniques to classify articles we scrape from the web.

In this hands-on workshop, we'll parse the Congressional Record, build a classifier, scrape search results, and analyze texts. You'll walk away with your own example of how to use data science to analyze political framing.

The full lineup of speakers for the Puget Sound conference is posted here. Tickets for the single-day event are $80 (see this link to request a discount code for half off).

Topics on the schedule for this event look juicy if quant work is your jam: AI, BERT, hypergraphs, visualization, forecasting, quantum computing, causal inference, survival analysis, writing better code and career management, with examples ranging from search, sales, and supply chain to economic disparity, DNA sequencing and saving wildlife!

Of Vikings, Barbie, and ‘The Wealth of Networks’

In The Wealth Of Networks, Yochai Benkler describes the opportunities and decisions presented by networked forms of production. Writing in the mid-2000s, Benkler describes a wide range of future policy battlegrounds: copyrights and patents, common carrier infrastructure, the accessibility of the public sphere, and the verification of information.

Benkler predicts: “How these battles turn out over the next decade or so will likely have a significant effect on how we come to know what is going on in the world we occupy, and to what extent and in what forms we will be able…to affect how we and others see the world as it is and as it might be.”

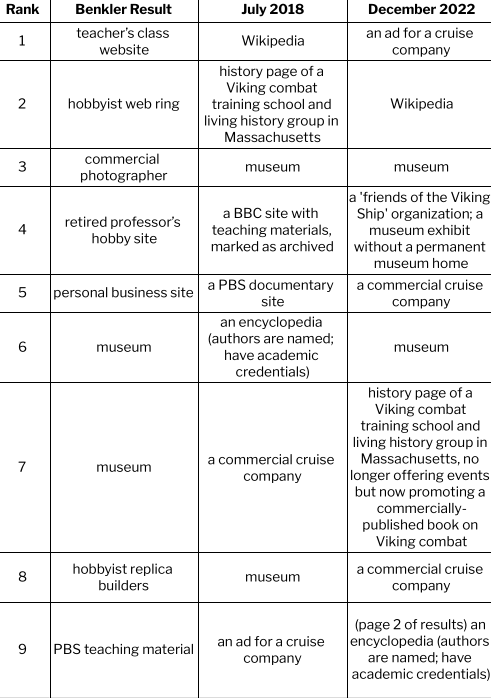
Benkler uses two simple search examples, reporting the results of searching for “Viking ship” and “Barbie”. He finds that enthusiastic individuals and independent voices dominate the content we see on the web and that various search engines construct meaning in varying ways. I repeat his examples (searches conducted 7/3/2018 and 12/1/2022, from my home near Seattle, WA and using my personal laptop).

So how do ‘we come to know what is going on in the world we occupy’? Who creates what we see online? And what implications does that have for our own freedom to shape the world? The short version of the answer to this question seems to be: if there was a battle, it’s over now and the wreckage has disappeared; individuals and independent voices are marginalized and commercial content is dominant — and this picture does not vary among search engines.

Viking Ships

I used the same search engine (Google) and the same term (Viking Ship): what I see is that the individual hobbyists Benkler saw in 2006 are eclipsed by institutions. The materials on the current sites sound similar to those Benkler saw – photos, replicas, and scholarly information, as well as links and learning materials – but the production is generally institutional and formal in contrast to the individual and informal sources Benkler reports.

One other shift: in 2022, simply listing links in order is not sufficient to report what searchers see. Search results are interspersed with many other features: a widget with “sources from across the web”, an images display with associated keywords, a “People also ask” widget, and a related searches widget; to reach the 9th “result” in the classic sense, I have to browse to the second page of results.

Searching for ‘Viking Ship’ in 2006, 2018, and 2022


Barbie

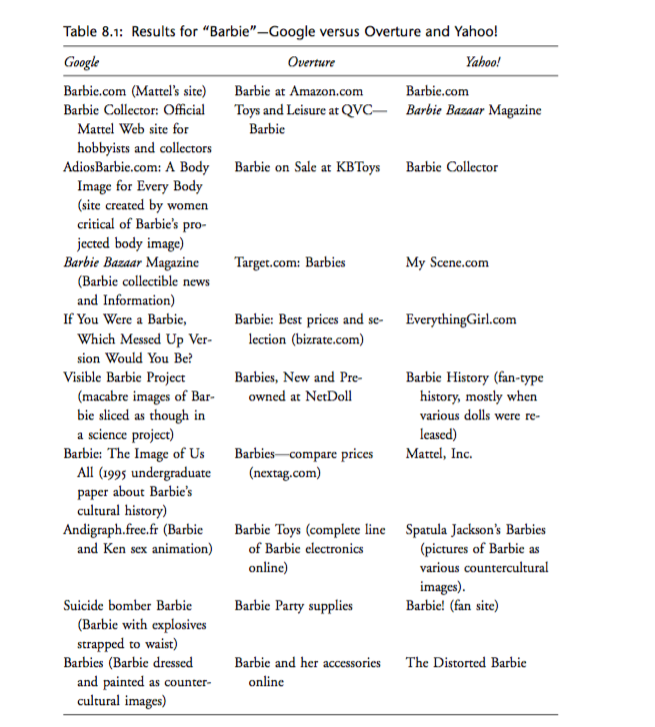
When I follow Benkler’s lead and search for ‘Barbie’ using three different search engines, the results are even more different from 2006. Benkler describes differences in search engine results as revealing different possibilities – via Google, Barbie was portrayed as “a culturally contested figure”, whereas on Overture (a now-defunct shopping-oriented search engine), the searcher encountered “a commodity toy.”

Here is Benkler’s figure 8, from page 286 of The Wealth of Networks:

a table showing search results from Google, Yahoo, and Overture

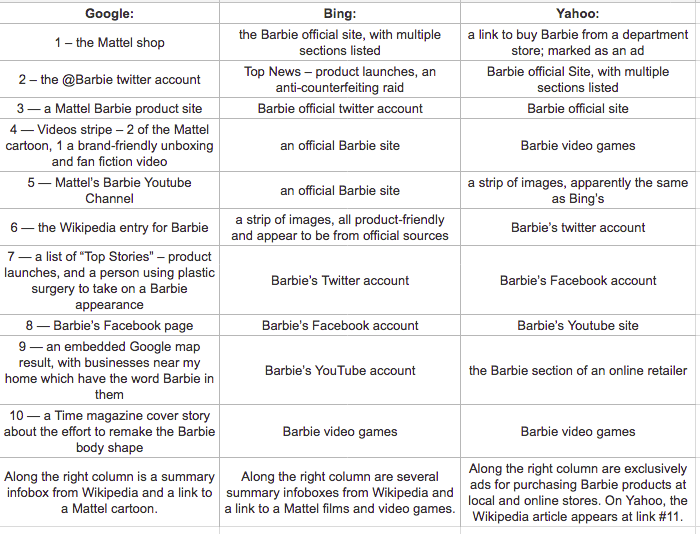
By contrast, my 2018 search via the then-current top 3 search engines, inclusive of widgets and other features, revealed:

a table showing search results from google, bing, and yahoo
Searching for ‘Barbie’ via the top 3 search engines in 2018.

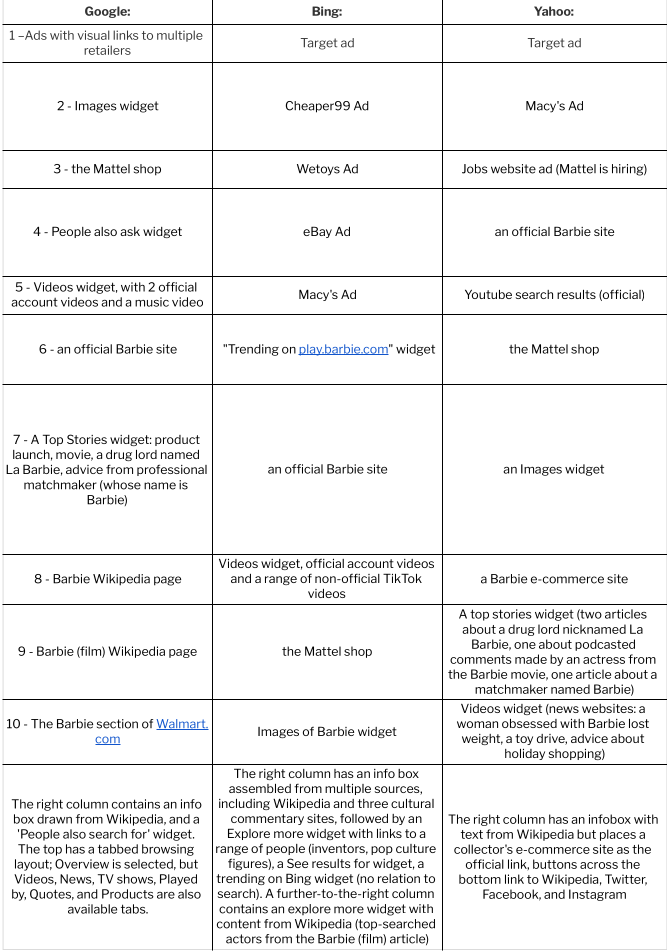
The top search engines in 2022 are the same three firms, although I observe that some sources suggest DuckDuckGo, Baidu (Chinese language only) and Yandex (Russian) belong in a top 5; other sources treat YouTube and Amazon as “top search engines” although they are not actually search engines. My 2022 search, inclusive of widgets and other features, revealed:

Searching for ‘Barbie’ via the top 3 search engines in 2022.

The modern Barbie searcher encounters primarily a multiplatform brand, with some hints of cultural constructions. In 2018 this took the form of extreme plastic surgery and brand-friendly fan fiction, in 2022 weight loss and fan TikTok. To whatever degree search engine algorithms continue to give weight to alternate voices in this case, they are largely drowned out by the volume of the commercial voice: the meaning of a search query for the single term “Barbie” has been substantially narrowed since Benkler’s time, and perhaps has narrowed even further in the last four and a half years.

The web in 2006 was indeed a different place, and I have commented on additional dimensions of analysis not present in Wealth: embedding of visual and social media content, and the widgetizing of content. In 2018, these visual components were less dominant: a stripe of Viking Ship images and a stripe of Barbie videos. In 2022 search, the page can scarcely be described without them.

We can now answer Benkler’s challenge: how did “these battles” over the last decade and a half “turn out”?

How do we “come to know what is going on in the world we occupy”?

How are we able “to affect how we and others see the world as it is and as it might be”?

The answer seems to be, it’s unclear to what degree there was a battle at all: collectives have triumphed over individuals on the Web insofar as search engines represent it. These collectives are generally firms, although some formal institutions are also present: news media, Wikipedia, and (in the case of Viking Ship) museums.

The implications of our search environment are significant, and underscore the necessity of efforts to archive and capture the search landscape as it appeared. The role of platforms and institutions in constructing our understanding of the world should be of key concern in information and communication sciences.

For civil society groups, these results suggest alienation: the commercializing of the web has been accompanied by a narrowing of outlets for individual expression and critique, with Wikipedia and its community co-construction of knowledge a vital bright spot. For journalists, these results suggest the vital role of cultural reporting. For firms, the challenge is one of authenticity and connection: to the extent that the web has become a broadcast medium focused on official paid messaging, the opportunity to engage with consumers is lost, and along with it a spark for innovation. Search platforms benefit in the mean time, as jockeying for ad positioning between manufacturers and retailers drives revenue, at least until commercialism turns consumer attention elsewhere.

Mapping the many pathways of learning in online communities

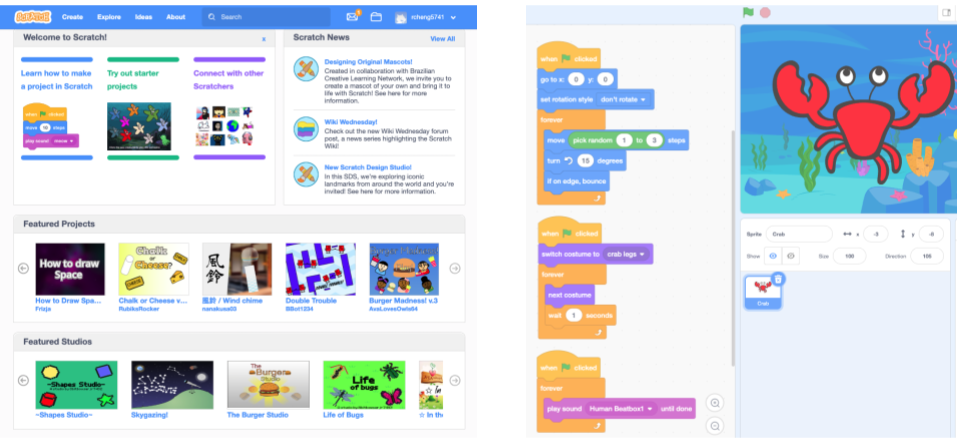
Thousands of widely used online communities are designed to promote learning. Although some rely on formal educational approaches like lesson plans, curriculum, and tests, many of the most successful learning communities online are structured as what scholars call a community of practice (CoP). In CoPs, members mentor and apprentice with each other (both formally and informally) while working toward a common interest or goal. For example, the Scratch online community is a CoP where millions of young people share and collaborate on programming projects.

Despite an enormous amount of attention paid to online CoPs, there is still a lot of disagreement about the best ways to promote learning in them. One source of disagreement stems from the fact that participants in CoPs are learning a number of different kinds of things and designers are often trying to support many types of learning at once. In a new paper that I’ve published—and that I will be presenting at CSCW this week—I conduct quantitative analyses on data from Scratch to show that there is a complex set of learning pathways at play in CoPs like Scratch. Types of participation that are associated with some important kinds of learning are often unrelated to, or even negatively associated with, other important types of learning outcomes. 

The Scratch online community (left) and an example of a programming project in Scratch (right). 

So what exactly are people learning in CoPs?  We dug into the CoP literature and identified three major types of learning outcomes: 

  • Learning about the domain, which refers to learning knowledge and skills for the core tasks necessary for achieving the explicit goal in the community. In Scratch, this is learning to code.
  • Learning about the community, which means the development of identity as a community member, forming relationships, affinities, and a sense of belonging. In Scratch, this involves learning to interact with others users and developing an identity as a community member.
  • Learning about the practice, which means adopting community specific values, such as the style of contribution that will be accepted and appreciated by its members. In Scratch, this means becoming a valued and respected contributor to the community.

So what types of participation might contribute to learning in a CoP?  We identified several different types of newcomers’ participation that may support learning:

  • Contribution to core tasks which involves direct work towards the community’s explicit goal. In Scratch, this often involves making original programming projects.
  • Engagement with practice proxies which involves observing and participating in others’ work practices. In Scratch, this might mean remixing others’ projects by making changes and building on existing code. 
  • Feedback exchange with community members about their contributions. In Scratch, this often involves writing comments on others’ projects.
  • Social bonding with community members. In Scratch, this can involve “friending” others, which allows a user to follow others’ projects and updates.
A visual representation of our study design.

We conducted a quantitative analysis on how the different types of newcomer participation contribute to the different learning outcomes. In other words, we tested for the presence/absence and the direction of the relationships (shown as the orange arrows) between each of the learning outcomes on the top of the figure and each of the types of newcomer participation on the bottom. To conduct these tests, we used data from Scratch to construct a user level dataset with proxy measures for each type of learning and type of newcomer participation as well as a series of important control variables. All the technical details about the measures and models are in the paper. 

Overall, what we found was a series of complex trade-offs that suggest the kinds of things that support one type of learning frequently do not support others. For example, we found that contribution to core tasks as a newcomer is positively associated with learning about the domain in the long term, but negatively associated with learning about the community and its practices. We found that engagement with practice proxies as a newcomer is negatively associated with long-term learning about the domain and the community. Engaging in feedback exchange and social bonding as a newcomer, on the other hand, are positively associated with learning about the community and its practice.

Our findings indicate that there are no easy solutions: different types of newcomer participation provide varying support for different learning outcomes. What is productive for some types of learning outcomes can be unhelpful for others, and vice versa. For example, although social features like feedback mechanisms and systems for creating social bonds may not be a primary focus of many learning systems, they could be implemented to help users develop a sense of belonging in the community and learn about community specific values. At the same time, while contributing to core tasks may help with domain learning, direct contribution may often be too difficult and might discourage newcomers from staying in the community and learn about its values.


The paper and this blog post are collaborative work between Ruijia “Regina” Cheng and Benjamin Mako Hill. The paper is being published this month(open access) in the Proceedings of the ACM on Human-Computer Interaction The full citation for this paper is: Ruijia Cheng and Benjamin Mako Hill. 2022. Many Destinations, Many Pathways: A Quantitative Analysis of Legitimate Peripheral Participation in Scratch. Proc. ACM Hum.-Comput. Interact. 6, CSCW2, Article 381 (November 2022), 26 pages https://doi.org/10.1145/3555106

The paper is also available as an arXiv preprint and in the ACM Digital Library. The paper is being presented several times at the Virtual CSCW conference taking place in November 2022. Both Regina and Mako are happy to answer questions over email, in the comments on this blog post, or at the one remaining presentation slot at the CSCW conference on November 16th at 8-9pm Pacific Time. 

OpenSym 2017 Program Postmortem

The International Symposium on Open Collaboration (OpenSym, formerly WikiSym) is the premier academic venue exclusively focused on scholarly research into open collaboration. OpenSym is an ACM conference which means that, like conferences in computer science, it’s really more like a journal that gets published once a year than it is like most social science conferences. The “journal”, in this case, is called the Proceedings of the International Symposium on Open Collaboration and it consists of final copies of papers which are typically also presented at the conference. Like journal articles, papers that are published in the proceedings are not typically published elsewhere.

Along with Claudia Müller-Birn from the Freie Universtät Berlin, I served as the Program Chair for OpenSym 2017. For the social scientists reading this, the role of program chair is similar to being an editor for a journal. My job was not to organize keynotes or logistics at the conference—that is the job of the General Chair. Indeed, in the end I didn’t even attend the conference! Along with Claudia, my role as Program Chair was to recruit submissions, recruit reviewers, coordinate and manage the review process, make final decisions on papers, and ensure that everything makes it into the published proceedings in good shape.

In OpenSym 2017, we made several changes to the way the conference has been run:

  • In previous years, OpenSym had tracks on topics like free/open source software, wikis, open innovation, open education, and so on. In 2017, we used a single track model.
  • Because we eliminated tracks, we also eliminated track-level chairs. Instead, we appointed Associate Chairs or ACs.
  • We eliminated page limits and the distinction between full papers and notes.
  • We allowed authors to write rebuttals before reviews were finalized. Reviewers and ACs were allowed to modify their reviews and decisions based on rebuttals.
  • To assist in assigning papers to ACs and reviewers, we made extensive use of bidding. This means we had to recruit the pool of reviewers before papers were submitted.

Although each of these things have been tried in other conferences, or even piloted within individual tracks in OpenSym, all were new to OpenSym in general.

Overview

Statistics
Papers submitted 44
Papers accepted 20
Acceptance rate 45%
Posters submitted 2
Posters presented 9
Associate Chairs 8
PC Members 59
Authors 108
Author countries 20

The program was similar in size to the ones in the last 2-3 years in terms of the number of submissions. OpenSym is a small but mature and stable venue for research on open collaboration. This year was also similar, although slightly more competitive, in terms of the conference acceptance rate (45%—it had been slightly above 50% in previous years).

As in recent years, there were more posters presented than submitted because the PC found that some rejected work, although not ready to be published in the proceedings, was promising and advanced enough to be presented as a poster at the conference. Authors of posters submitted 4-page extended abstracts for their projects which were published in a “Companion to the Proceedings.”

Topics

Over the years, OpenSym has established a clear set of niches. Although we eliminated tracks, we asked authors to choose from a set of categories when submitting their work. These categories are similar to the tracks at OpenSym 2016. Interestingly, a number of authors selected more than one category. This would have led to difficult decisions in the old track-based system.
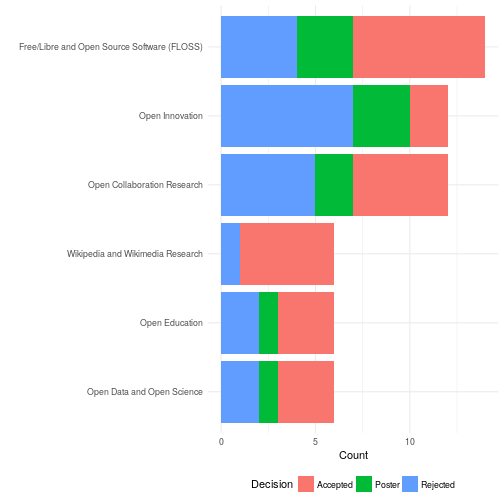
distribution of papers across topics with breakdown by accept/poster/reject

The figure above shows a breakdown of papers in terms of these categories as well as indicators of how many papers in each group were accepted. Papers in multiple categories are counted multiple times. Research on FLOSS and Wikimedia/Wikipedia continue to make up a sizable chunk of OpenSym’s submissions and publications. That said, these now make up a minority of total submissions. Although Wikipedia and Wikimedia research made up a smaller proportion of the submission pool, it was accepted at a higher rate. Also notable is the fact that 2017 saw an uptick in the number of papers on open innovation. I suspect this was due, at least in part, to work by the General Chair Lorraine Morgan’s involvement (she specializes in that area). Somewhat surprisingly to me, we had a number of submission about Bitcoin and blockchains. These are natural areas of growth for OpenSym but have never been a big part of work in our community in the past.

Scores and Reviews

As in previous years, review was single blind in that reviewers’ identities are hidden but authors identities are not. Each paper received between 3 and 4 reviews plus a metareview by the Associate Chair assigned to the paper. All papers received 3 reviews but ACs were encouraged to call in a 4th reviewer at any point in the process. In addition to the text of the reviews, we used a -3 to +3 scoring system where papers that are seen as borderline will be scored as 0. Reviewers scored papers using full-point increments.
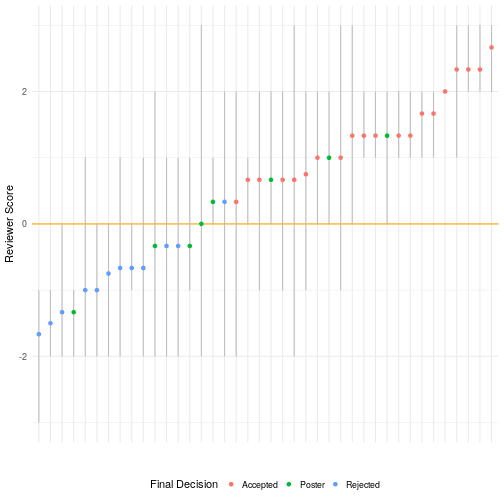
scores for each paper submitted to opensym 2017: average, distribution, etc

The figure above shows scores for each paper submitted. The vertical grey lines reflect the distribution of scores where the minimum and maximum scores for each paper are the ends of the lines. The colored dots show the arithmetic mean for each score (unweighted by reviewer confidence). Colors show whether the papers were accepted, rejected, or presented as a poster. It’s important to keep in mind that two papers were submitted as posters.

Although Associate Chairs made the final decisions on a case-by-case basis, every paper that had an average score of less than 0 (the horizontal orange line) was rejected or presented as a poster and most (but not all) papers with positive average scores were accepted. Although a positive average score seemed to be a requirement for publication, negative individual scores weren’t necessary showstoppers. We accepted 6 papers with at least one negative score. We ultimately accepted 20 papers—45% of those submitted.

Rebuttals

This was the first time that OpenSym used a rebuttal or author response and we are thrilled with how it went. Although they were entirely optional, almost every team of authors used it! Authors of 40 of our 46 submissions (87%!) submitted rebuttals.

Lower Unchanged Higher
6 24 10

The table above shows how average scores changed after authors submitted rebuttals. The table shows that rebuttals’ effect was typically neutral or positive. Most average scores stayed the same but nearly two times as many average scores increased as decreased in the post-rebuttal period. We hope that this made the process feel more fair for authors and I feel, having read them all, that it led to improvements in the quality of final papers.

Page Lengths

In previous years, OpenSym followed most other venues in computer science by allowing submission of two kinds of papers: full papers which could be up to 10 pages long and short papers which could be up to 4. Following some other conferences, we eliminated page limits altogether. This is the text we used in the OpenSym 2017 CFP:

There is no minimum or maximum length for submitted papers. Rather, reviewers will be instructed to weigh the contribution of a paper relative to its length. Papers should report research thoroughly but succinctly: brevity is a virtue. A typical length of a “long research paper” is 10 pages (formerly the maximum length limit and the limit on OpenSym tracks), but may be shorter if the contribution can be described and supported in fewer pages— shorter, more focused papers (called “short research papers” previously) are encouraged and will be reviewed like any other paper. While we will review papers longer than 10 pages, the contribution must warrant the extra length. Reviewers will be instructed to reject papers whose length is incommensurate with the size of their contribution.

The following graph shows the distribution of page lengths across papers in our final program.
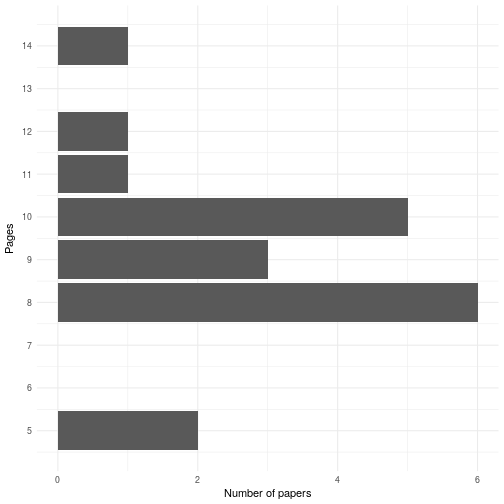
histogram of paper lengths for final accepted papersIn the end 3 of 20 published papers (15%) were over 10 pages. More surprisingly, 11 of the accepted papers (55%) were below the old 10-page limit. Fears that some have expressed that page limits are the only thing keeping OpenSym from publshing enormous rambling manuscripts seems to be unwarranted—at least so far.

Bidding

Although, I won’t post any analysis or graphs, bidding worked well. With only two exceptions, every single assigned review was to someone who had bid “yes” or “maybe” for the paper in question and the vast majority went to people that had bid “yes.” However, this comes with one major proviso: people that did not bid at all were marked as “maybe” for every single paper.

Given a reviewer pool whose diversity of expertise matches that in your pool of authors, bidding works fantastically. But everybody needs to bid. The only problems with reviewers we had were with people that had failed to bid. It might be reviewers who don’t bid are less committed to the conference, more overextended, more likely to drop things in general, etc. It might also be that reviewers who fail to bid get poor matches which cause them to become less interested, willing, or able to do their reviews well and on time.

Having used bidding twice as chair or track-chair, my sense is that bidding is a fantastic thing to incorporate into any conference review process. The major limitations are that you need to build a program committee (PC) before the conference (rather than finding the perfect reviewers for specific papers) and you have to find ways to incentivize or communicate the importance of getting your PC members to bid.

Conclusions

The final results were a fantastic collection of published papers. Of course, it couldn’t have been possible without the huge collection of conference chairs, associate chairs, program committee members, external reviewers, and staff supporters.

Although we tried quite a lot of new things, my sense is that nothing we changed made things worse and many changes made things smoother or better. Although I’m not directly involved in organizing OpenSym 2018, I am on the OpenSym steering committee. My sense is that most of the changes we made are going to be carried over this year.

Finally, it’s also been announced that OpenSym 2018 will be in Paris on August 22-24. The call for papers should be out soon and the OpenSym 2018 paper deadline has already been announced as March 15, 2018. You should consider submitting! I hope to see you in Paris!

This Analysis

OpenSym used the gratis version of EasyChair to manage the conference which doesn’t allow chairs to export data. As a result, data used in this this postmortem was scraped from EasyChair using two Python scripts. Numbers and graphs were created using a knitr file that combines R visualization and analysis code with markdown to create the HTML directly from the datasets. I’ve made all the code I used to produce this analysis available in this git repository. I hope someone else finds it useful. Because the data contains sensitive information on the review process, I’m not publishing the data.