A paper recently published at CSCW describes the results of a forensic qualitative analysis of contributions made to Wikipedia through the anonymous browsing system Tor. The project was conducted collaboratively with researchers from Drexel, NYU, and the University of Washington and complements a quantitative analysis of the same data we also published to provide a rich qualitative picture of what anonymity-seekers are trying to do when they contribute to Wikipedia. The work also shows how the ability to stay anonymous can play a important role in facilitating certain types of contributions to online knowledge bases like Wikipedia.
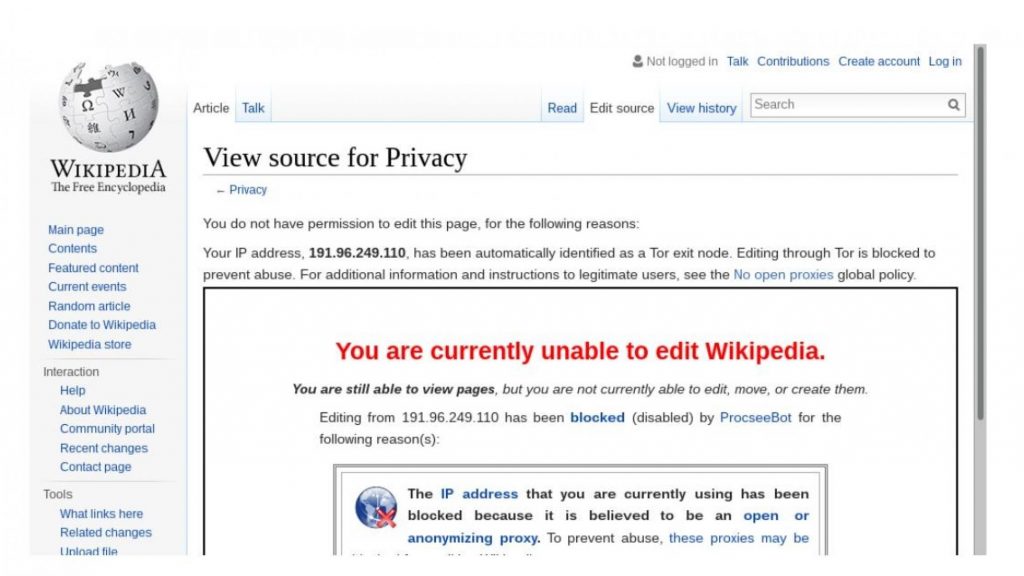
Media reports often describe how online platforms are tracking us. That said, trying to live our lives online without leaving a trail of our personal information can be difficult because many services can’t be used without an account and systems that protect privacy are often blocked. One popular approach to protecting our privacy online involves using the Tor network. Tor protects users from being identified by their IP address which can be tied to a physical location. However, if you’d like to contribute to Wikipedia using Tor, you’ll run into a problem. Although most IP addresses can edit without an account, Tor users are blocked from editing.
Other research by my team has shown that Wikipedia’s attempt to block Tor is imperfect and that some people have been able to edit despite the ban. This work also built a dataset of more than 11,000 contributions made to Wikipedia via Tor and used quantitative analysis to show that the contributions of people using Tor were about the same quality as contributions from other new editors and other contributors without accounts. Of course, given the unusual circumstances Tor-based contributors faced, we wondered if a deeper look into the content of their edits might tell us more about their motives and the kinds of contributions they seek to make. I led a qualitative investigation that sought to explore these questions.
Given the challenges of studying anonymity seekers, we designed a novel “forensic” qualitative approach that was inspired by the techniques common in the practice of computer security as well as criminal investigation. We applied to this new technique to a sample of 500 different editing sessions and sorted each session into a category based on what the editor seemed to be intending to do.
Most of the contributions we found fell into one of the two following categories:
- Many contributions were quotidian attempts to add to the encyclopedia. Tor-based editors added facts, they fixed typos, and they updated train schedules. There’s no way to know if these individuals knew that they were just getting lucky in their ability to edit or if they were patiently reloading to evade the ban.
- Second, we found harassing comments and vandalism. Unwelcome conduct is common in online environments, and sometimes more common when the likelihood of being identified is decreased. Some of the harassing comments we observed were direct responses to being banned as a Tor user.
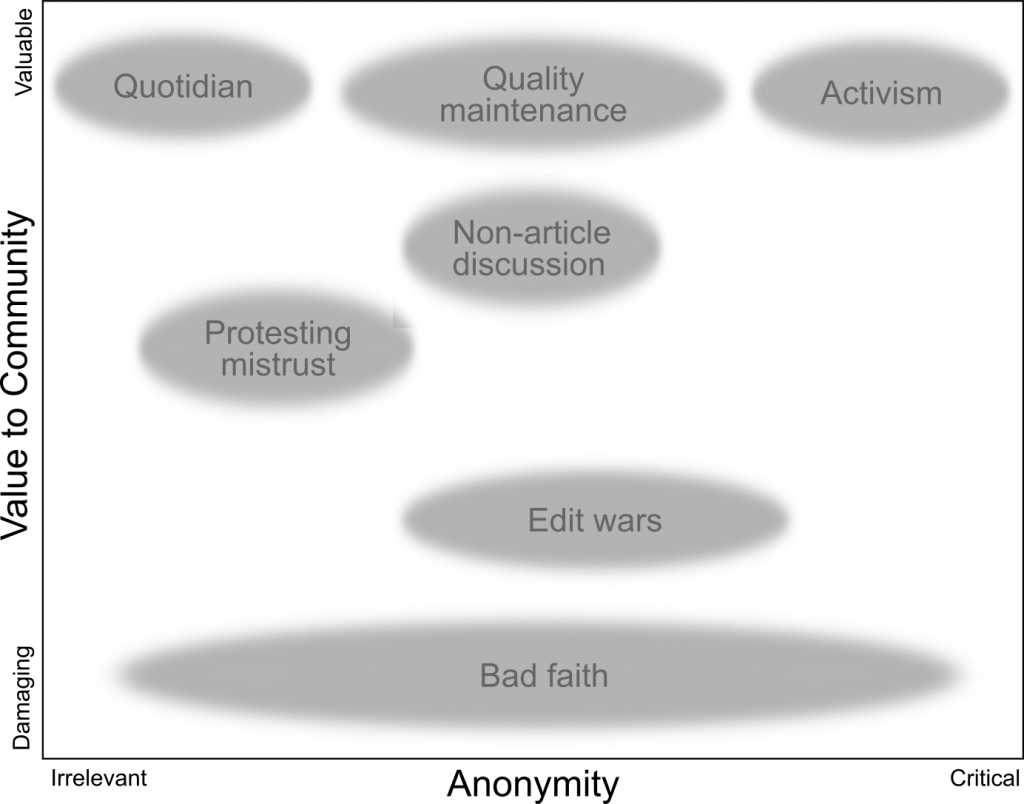
Although these were most of what we observed, we also found evidence of several types of contributor intent:
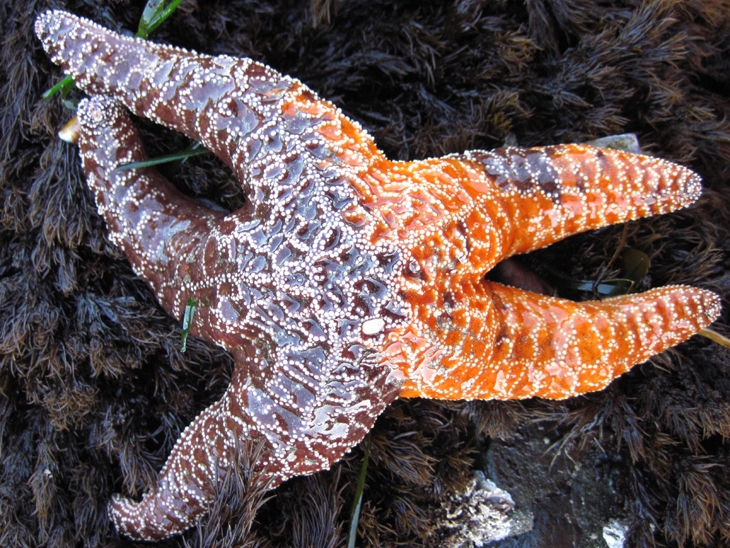
- We observed activism, as when a contributor tried to bring attention to journalistic accounts of environmental and human rights abuses being committed by a mining company, only to have editors traceable to the mining company repeatedly remove their edits. Another example included an editor trying to diminish the influence of alternative medicine proponents.
- We also observed quality maintenance activities when editors used Wikipedia’s rules about appropriate sourcing to remove personal websites being cited in conspiracy theories.
- We saw edit wars with Tor editors participating in a back-and-forth removal and replacement of content as part of a dispute, in some cases countering the work of an experienced Wikipedia editor who even other experienced editors had gauged to be biased.
- Finally, we saw Tor-based editors participating in non-article discussions such as investigations of administrator misconduct, and protesting the mistrust of Tor editors by the Wikipedia platform.
In all, these themes led us to reflect on how the risks that individuals face when contributing to online communities are sometimes out of alignment with the risks the communities face by accepting their work. Expressing minoritized perspectives, maintaining community standards even when you may be targeted by the rulebreaker, highlighting injustice or acting as a whistleblower can be very risky for an individual, and may not be possible without privacy protections. Of course, in platforms seeking to support the public good, such knowledge and accountability may be crucial.
This project was conducted by Kaylea Champion, Nora McDonald, Stephanie Bankes, Joseph Zhang, Rachel Greenstadt, Andrea Forte, and Benjamin Mako Hill. This work was supported by the National Science Foundation (awards CNS-1703736 and CNS-1703049) and included the work of two undergraduates supported through an NSF REU supplement.
Paper Citation: Kaylea Champion, Nora McDonald, Stephanie Bankes, Joseph Zhang, Rachel Greenstadt, Andrea Forte, and Benjamin Mako Hill. 2019. A Forensic Qualitative Analysis of Contributions to Wikipedia from Anonymity Seeking Users. Proceedings of the ACM on Human-Computer Interactaction. 3, CSCW, Article 53 (November 2019), 26 pages. https://doi.org/10.1145/3359155


