In the fourth talk of the Science of Community track we organized for FOSSY, principal developer advocate Paige Cruz shared the results of her investigation into the subject of how we can all do a better job of asking questions of one another in FOSS communities. One of her key insights is to invite us to engage with the perspective of those who might answer our question, and to think critically about what details we include and whether they really help others understand and respond — for example, a screenshot of our code can’t be copy pasted and might be unreadable, but a screenshot of a UI bug might replace wordy description.
This is part 4 of an 8-part series sharing highlights from the Science of Community track at FOSSY. Visit the FOSSY site for more bio details and an abstract of the talk.
In the third talk of the Science of Community track we organized for FOSSY, FOSS leader Ben Ford described his experience navigating the changes in his role when the Puppet project’s commercial partner was acquired by a private equity company. One of the essential takeaways from this talk is the different perspective towards community that a FOSS company takes versus a private equity company, and the challenge of communicating value in this context.
This is part 3 of an 8-part series sharing highlights from the Science of Community track at FOSSY. Visit the FOSSY site for more bio details and an abstract of the talk.
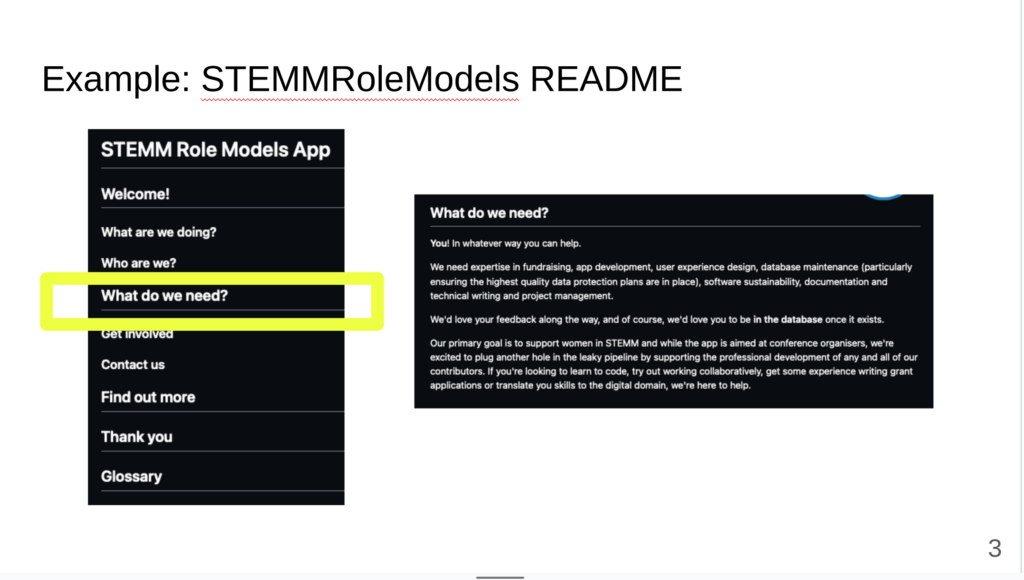
In the second talk of the Science of Community track we organized for FOSSY, CDSC PhD student Matthew Gaughan shared his research to understand how communities actually use README and CONTRIBUTING documents. Although guides to FOSS communities often recommend these documents be extensive and used as part of welcoming new contributors, we find that READMEs are often quite preliminary, and that CONTRIBUTING guides are often a reaction to an influx of contributions.
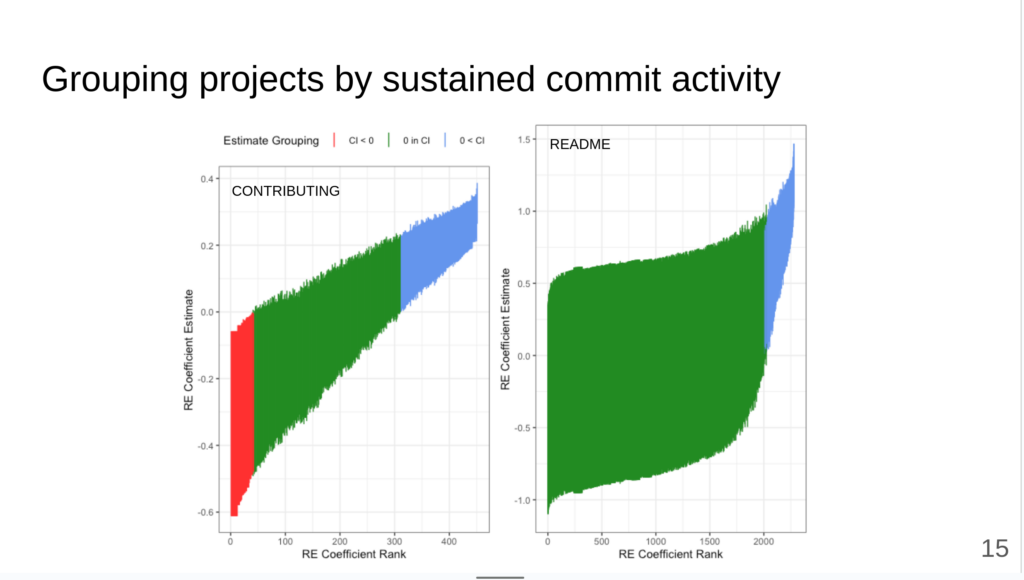
Excerpt from Matt’s presentation, Graph shows model coefficients for longitudinal activity data around governance document introduction for 2200+ FOSS projects packaged in the Debian GNU/Linux distribution.
This is part 2 of an 8-part series sharing highlights from the Science of Community track at FOSSY. Visit the FOSSY site for more bio details and an abstract of the talk.
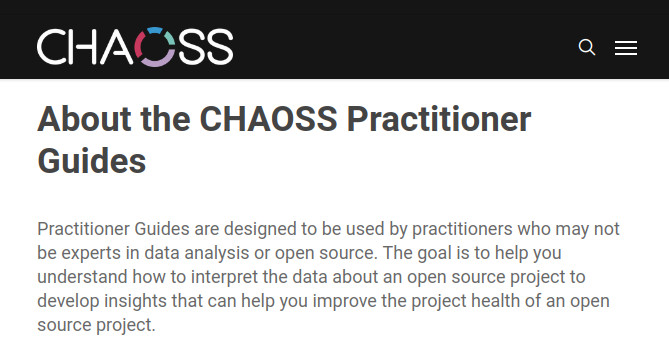
Back in July, we kicked off the FOSSY conference Science of Community track with a talk from Dr. Dawn Foster. Dr. Foster shared an update on the work of the CHAOSS project to empower communities to use metrics to understand and improve their practices. Their Practitioner Guide Series, coupled with FOSS analytical tools, will help any community get started on their metrics journey.
This is part 1 of an 8-part series sharing highlights from the Science of Community track at FOSSY. Visit the FOSSY site for more bio details and an abstract of the talk.
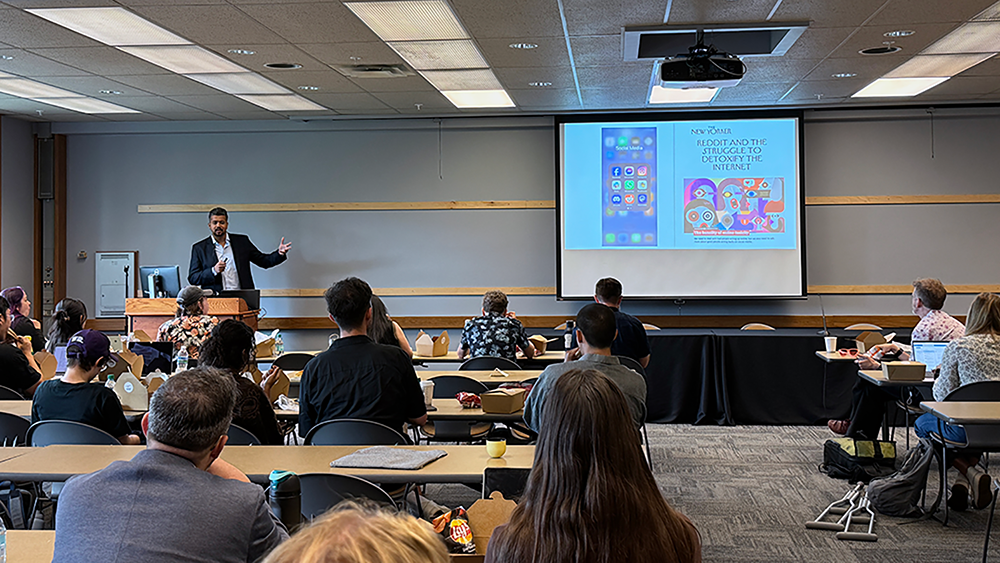
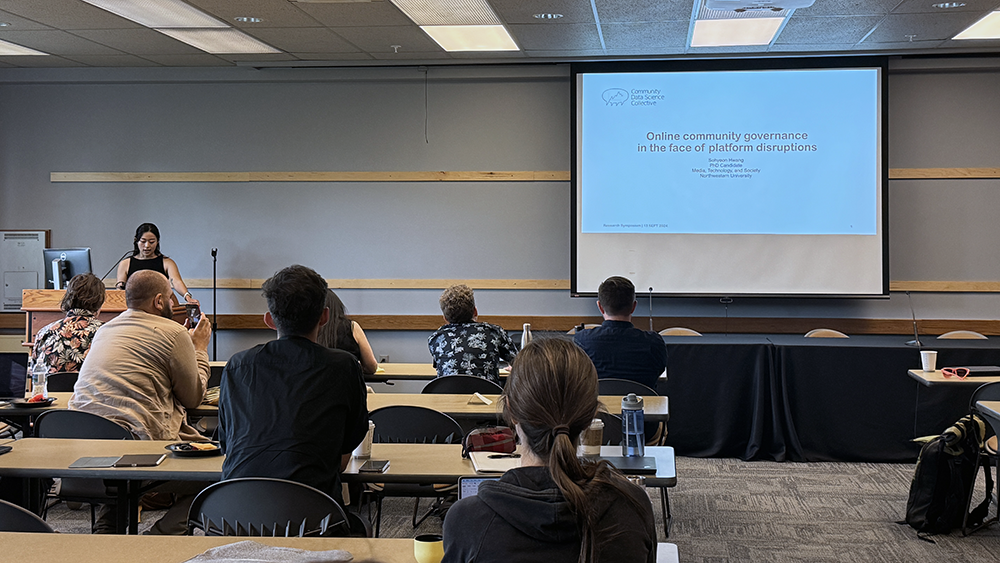
On September 27th, we held our 9th Science of Community Dialogue with Sohyeon Hwang (Northwestern) and Seth Frey (University of California-Davis) sharing their research and insights on how communities self-govern amidst competing pressures in complex, multi-layered environments.
Sohyeon presented her work on “Trust and Friction: Community Governance and Privacy on Decentralized Social Media”. Her research aimed to answer the questions of “what aspects of community governance do communities use to shape privacy expectations?” and “how does the decentralized nature of that platform aid or undermine those expectations?”
Seth discussed his research on Apache, looking to answer the question “do things run the way they say they run?” His research explored the relationships between rules and regulations, how often these same rules as discussed among the community, and what exactly is being governed.
All in all, it was a wonderful dialogue and we greatly appreciate Sohyeon and Seth taking the time to share their research, as well as all our attendees joining us for a great discussion.
Thinking about applying to graduate school? Wonder what it’s like to pursue a PhD? Interested in understanding relationships between technology and society? Curious about how to do research on online communities like Reddit, Wikipedia, or GNU/Linux? The Community Data Science Collective is hosting a virtual Q&A session on October 18th at 12 pm PT, 2pm CT, 3pm ET for prospective students. This session is scheduled for an hour, to be divided between a larger group session with faculty and then smaller groups with current graduate students. If you would like to attend, register at this link!
This post provides a very brief run-down on the CDSC, the different universities and Ph.D. programs our faculty members are affiliated with, and some general ideas about what we’re looking for when we review Ph.D. applications.
What are these different Ph.D. programs? Why would I choose one over the other?
This year the group includes four faculty principal investigators (PIs) who are actively recruiting PhD students: Aaron Shaw (Northwestern University), Benjamin Mako Hill (University of Washington in Seattle), Nathan TeBlunthuis (University of Texas at Austin) and Jeremy Foote (Purdue University). Each of these PIs advise Ph.D. students in Ph.D. programs at their respective universities. Our programs are each described below.
Although we often work together on research and serve as co-advisors to students in each others’ projects, each faculty person has specific areas of expertise and interests. The reasons you might choose to apply to one Ph.D. program or to work with a specific faculty member could include factors like your previous training, career goals, and the alignment of your specific research interests with our respective skills.
At the same time, a great thing about the CDSC is that we all collaborate and regularly co-advise students across our respective campuses, so the choice to apply to or attend one program does not prevent you from accessing the expertise of our whole group. But please keep in mind that our different Ph.D. programs have different application deadlines, requirements, and procedures!
Faculty who are actively recruiting this year
If you are interested in applying to any of the programs, we strongly encourage you to reach out the specific faculty in that program before submitting an application.
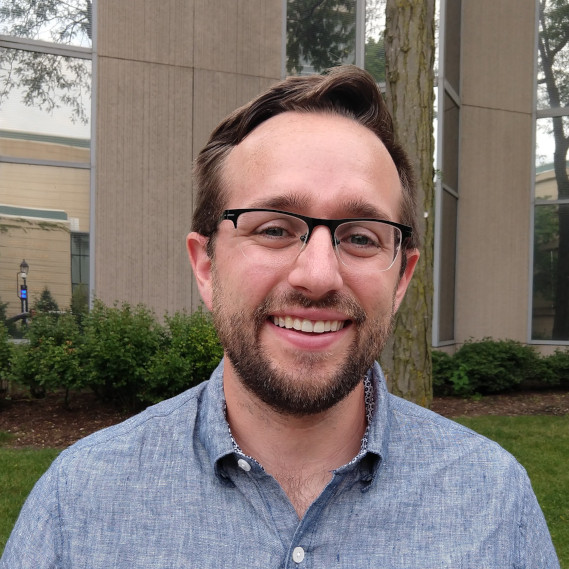
Jeremy Foote
Jeremy Foote is an Assistant Professor at the Brian Lamb School of Communication at Purdue University. He is affiliated with the Organizational Communication and Media, Technology, and Society programs. Jeremy’s research focuses on how individuals decide when and in what ways to contribute to online communities, how communities change the people who participate in them, and how both of those processes can help us to understand which things become popular and influential. He and his students use multiple methods, including data science, agent-based modeling, field experiments, and interviews.
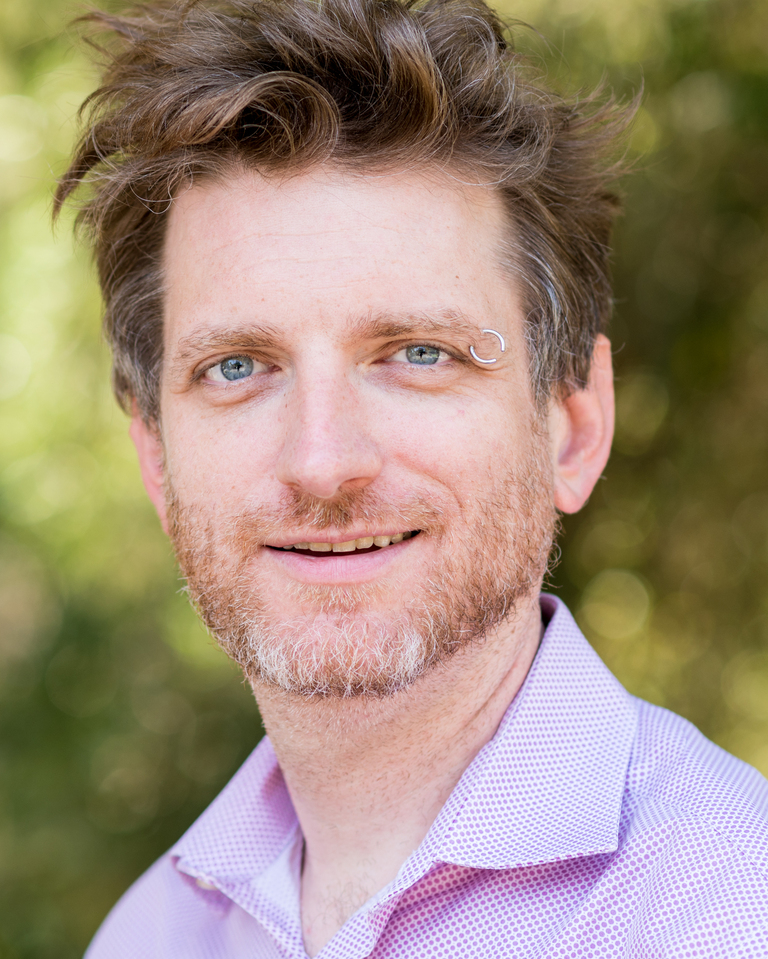
Benjamin Mako Hill
Benjamin Mako Hill is an Associate Professor of Communication at the University of Washington. He is also adjunct faculty at UW’s Department of Human-Centered Design and Engineering (HCDE), Computer Science and Engineering (CSE) and Information School. Although many of Mako’s students are in the Department of Communication, he has also advised students in all three other departments—although he typically has more limited ability to admit students into those programs on his own and usually does so with a co-advisor in those departments. Mako’s research focuses on population-level studies of peer production projects, computational social science, efforts to democratize data science, and informal learning. Mako has also put together a webpage for prospective graduate students with some useful links and information.
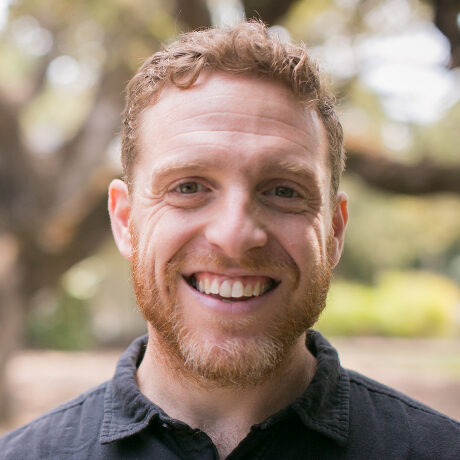
Aaron Shaw, Nikki Ritcher Photography
AaronShaw is an Associate Professor in the Department of Communication Studies at Northwestern. In terms of Ph.D. programs, Aaron’s primary affiliations are with the Media, Technology and Society (MTS) and the Technology and Social Behavior (TSB) Ph.D. programs (please note: the TSB program is a joint degree between Communication and Computer Science). Aaron also has a courtesy appointment in the Sociology Department at Northwestern, but he has not directly supervised any Ph.D. advisees in that department (yet). Aaron’s current projects focus on comparative analysis of the organization of peer production communities and social computing projects, participation inequalities in online communities, and collaborative organizing in pursuit of public goods.
There’s no easy or singular answer to this. In general, we look for curious, intelligent people driven to develop original research projects that advance scientific and practical understanding of topics that intersect with any of our collective research interests.
To get an idea of the interests and experiences present in the group, read our respective bios and CVs (follow the links above to our personal websites). Specific skills that we and our students tend to use on a regular basis include consuming and producing social science and/or social computing (human-computer interaction) research; applied statistics and statistical computing, various empirical research methods, social theory and cultural studies, and more.
Formal qualifications that speak to similar skills and show up in your resume, transcripts, or work history are great, but we are much more interested in your capacity to learn, think, write, analyze, and/or code effectively than in your credentials, test scores, grades, or previous affiliations. It’s graduate school and we do not expect you to show up knowing how to do all the things already.
Intellectual creativity, persistence, and a willingness to acquire new skills and problem-solve matter a lot. We think doctoral education is less about executing tasks that someone else hands you and more about learning how to identify a new, important problem; develop an appropriate approach to solving it; and explain all of the above and why it matters so that other people can learn from you in the future. Evidence that you can or at least want to do these things is critical. Indications that you can also play well with others and would make a generous, friendly colleague are really important too.
All of this is to say, we do not have any one trait or skill set we look for in prospective students. We strive to be inclusive along every possible dimension. Each person who has joined our group has contributed unique skills and experiences as well as their own personal interests. We want our future students and colleagues to do the same.
Now what?
Still not sure whether or how your interests might fit with the group? Still have questions? Still reading and just don’t want to stop? Follow the links above for more information. Feel free to send at least one of us an email. We are happy to try to answer your questions and always eager to chat. You can also register for and join our Q+A session on October 18 at 2:00pm CT.
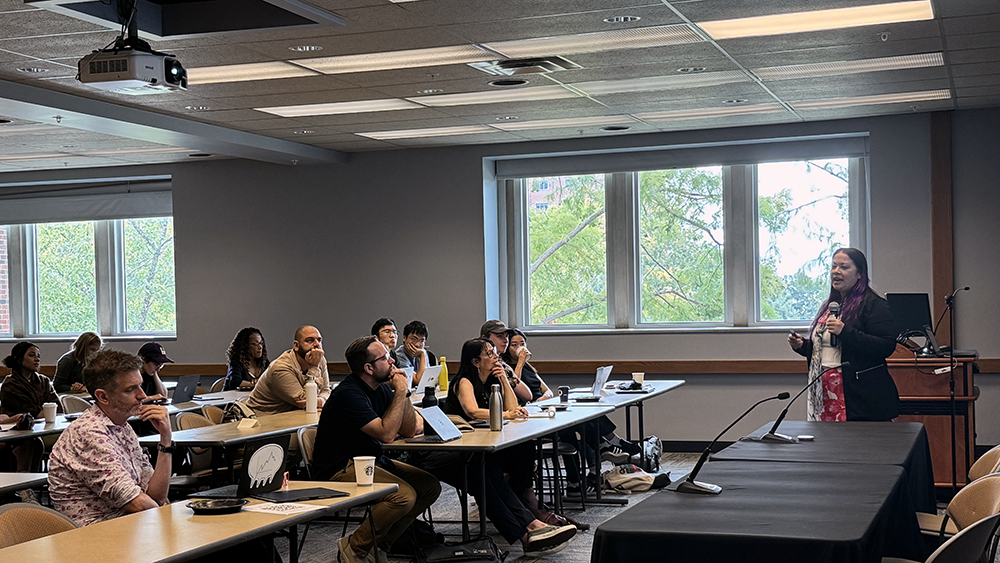
On September 13th, the Community Data Science Collective led the “Frontiers in Online Community Research Symposium” at Purdue University. We had a number of fantastic presenters and panelists discussing topics from moderating the Fediverse to the role of LLMs in online communities and how different academic disciplines approach online community research.
Eshwar Chandrashekharan (University of Illinois at Urbana-Champaign) joined as our keynote speaker. He presented research he and his group have been working on titled, “Proactive Approaches to Promote Community Resilience and Foster Desirable Behavior Online”. Eshwar discussed ongoing efforts to combat undesirable online behaviors through research and design that promote resilience and facilitate positive interactions within online conversations and communities.
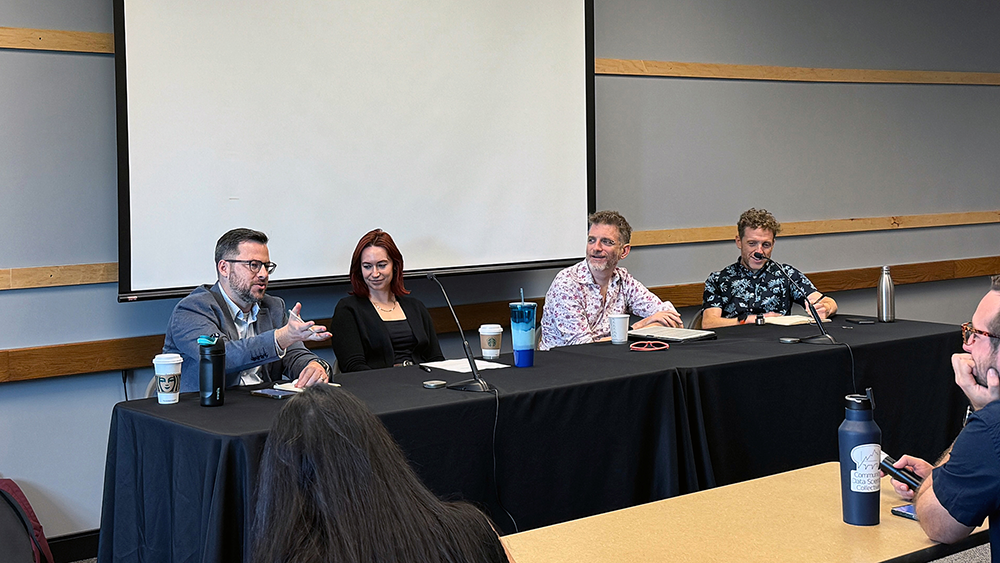
Prior to Eshwar’s keynote, we had an opening panel and research presentations by CDSC members. For the opening panel, Purdue professors Diana Zulli (Communication) and Marcus Mann (Sociology) joined CDSC faculty Aaron Shaw (Northwestern), and Mako Hill (University of Washington) for an introductory Q&A panel. The panel discussed what we know about online communities, what new questions we are just starting to answer, and what exciting new methods are being used.
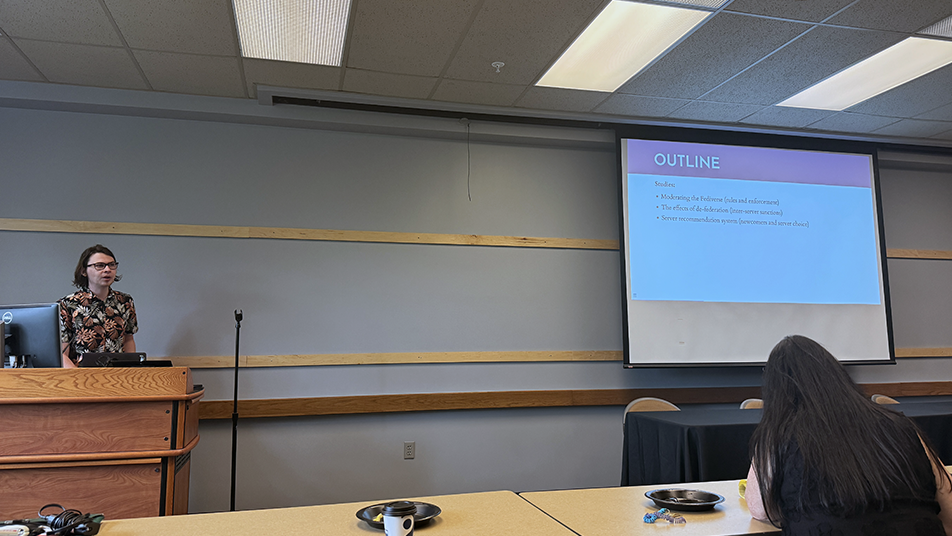
Following the panel, CDSC students Carl Colglazier (Northwestern), Sohyeon Hwang (Northwestern), and Kaylea Champion (University of Washington) gave really wonderful talks on their research. Carl talked about his work on moderation in the Fediverse, and the impact of site-level blocking. Sohyeon provided a number of provocations about community governance in the face of AI-driven changes, while Kaylea discussed her work on underproduction in social systems. They all gave fantastic presentations and inspired great conversations among attendees.
Overall, it was an excellent symposium that we hope helps to push our field forward. Thank you to all who attended and made it such a great event. A special thank you to the CDSC Purdue members for organizing the event and to Thatiany Andrade Nunes for taking photos!
We’re excited to welcome Dionna Taylor, Loizos Bitsikokos, and Thaty (pronounced Tatchi) Andrade Nunes as new core student members of CDSC!
Dionna is a first year MA/PhD student in the Communication Department at the University of Washington, being advised by Mako. She earned her B.A. in Psychology and Communication (also from UW) and is interested in the intersection of human behavior and technology, with a primary focus on online community collapse and online healthcare spaces. In her free time, you can find her reading, line dancing, or traveling.
Loizos is a PhD student at Purdue University’s Brian Lamb School of Communication. His academic journey began with degrees in physics and applied mathematics from the National Technical University of Athens (N.T.U.A.), followed by an MA in computational social science from the University of Chicago, focusing on sociology. His research lies at the intersection of computational social science, online platforms, and organizations. He’s particularly interested in the intricate relationship between algorithms and society. He also studies the tensions between structure and agency within online platforms, examining how platforms influence identity formation and whether users can resist institutionally ingrained biases. His work investigates the conceptualization of desire within platform infrastructures. When he has free time outside of academia, Loizos enjoys writing poems, making and collecting zines, watching cinema, taking photographs, walking in nature, and occasionally playing the saxophone.
Thaty (pronounced like Tatchi) is a first-year PhD student in the Media, Technology, and Society program at Northwestern University, advised by Professor Aaron Shaw. Her interest in studying online communities began while working at game companies in South Korea. In addition to creating social media videos, she was responsible for organizing engaging community events and managing online communities. She was fascinated by how quickly these communities could self-organize, whether by creating guides, wikis, or establishing their own rules and moderation systems. Thaty wants to investigate how communication and information technologies influence social outcomes, how online communities influence participants, what kind of participants (lurkers or active) join them, and why and how they contribute. She’s also interested in the different forms of community engagement such as collaboration, political mobilization, and organization. She’s originally from Brazil, lived in South Korea for seven years, and speaks Portuguese, English, Korean, and some Spanish! In her free time, she enjoys playing story-driven video games, watching horror movies/series, and spending time with friends
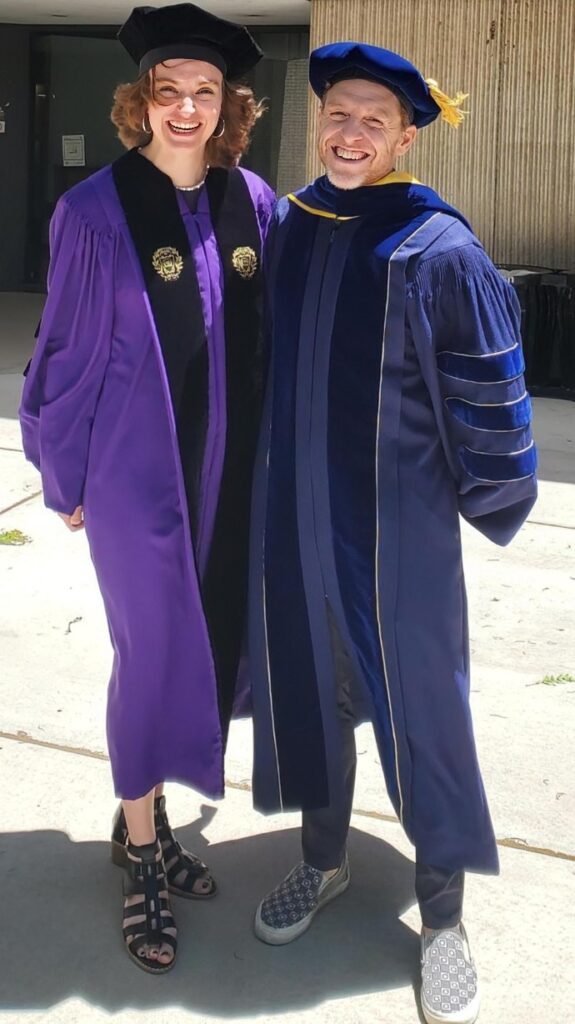
Floor and Aaron just before Northwestern’s doctoral hooding ceremony.
A very special congratulations to CDSC member Floor Fiers on the completion of their Ph.D. in Media, Technology & Society at Northwestern!
Floor’s dissertation Chasing the Ideal and Making It Work: Pursuing Employment in the Remote Gig Economy, seeks to understand inequality among workers in the gig economy and how they navigate the precarity involved in remote gig work. Several of the chapters have already appeared as standalone, peer-reviewed publications, but there’s plenty of new, exciting, and as-yet-unpublished material in there as well.
This week (!), Floor will begin a position as Assistant Professor in the Amsterdam School of Communication Research (ASCoR) at the University of Amsterdam.
Since I (Aaron) am posting this one myself, it seems appropriate to add that it’s been wonderful working with Floor over the past five+ years. Indeed, I’m still in denial about the fact that Floor won’t be physically present in our lab meetings this year. At the same time, I couldn’t be happier for Floor and definitely get a goofy, proud-faculty-mentor grin on my face whenever I think about the incredible things they’ve accomplished already (nevermind all the cool stuff yet to come).
Interested in free and open source software? Want to hear insights from researchers, community leaders, contributors, and advocates working on and with FOSS?
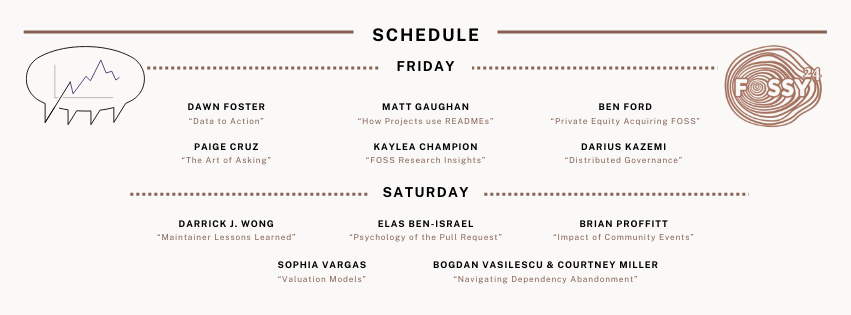
We will be running the Science of Community track on Friday August 2nd and Saturday August 3rd. We’re excited to have a number of awesome presenters speaking about their work. Check out the schedule below:
The Science of Community track is inspired by the CDSC Science of Community Dialogues, which aim to bring together practitioners and researchers to discuss scholarly work that is relevant to the efforts of practitioners. As researchers, we get so much from the communities we work with and study and we want them to also learn from the research they so generously take part in. While the Dialogues cover a broad range of topics and communities, FOSSY presentations focus on how that work related to free and open source software communities, projects, and practitioners.
Collaborations between practitioners and researchers can be transformative! Let’s get to know each other.
Tickets are still available at every price tier, check them out here.