How can communities develop and understand accountable governance? So many online environments rely on community members in profound ways without being accountable to them in direct ways. In this session, we will explore this topic and its implications for online communities and platforms.
First, Nick Vincent (Northwestern, UC Davis) will discuss the opportunities for so-called “data leverage” and will highlight the potential to push back on the “data status quo” to build compelling alternatives, including the potential for “data dividends” that allow a broader set of users to economically benefit from their contributions.
The idea of “data leverage” comes out of a basic, but little discussed fact: Many technologies are highly reliant on content and behavioral traces created by everyday Internet users, and particularly online community members who contribute text, images, code, editorial judgement, rankings, ratings, and more.. The technologies that rely on these resources include ubiquitous and familiar tools like search engines as well as new bleeding edge “Generative AI” systems that produce novel art, prose, code and more. Because these systems rely on contributions from Internet users, collective action by these users (for instance, withholding content) has the potential to impact system performance and operators.
Next, Amy Zhang (University of Washington) will discuss how communities can think about their governance and the ways in which the distribution of power and decision-making are encoded into the online community software that communities use. She will then describe a tool called PolicyKit that has been developed with the aim of breaking out of common top-down models for governance in online communities to enable governance models that are more open, transparent, and democratic. PolicyKit works by integrating with a community’s platform(s) of choice for online participation (e.g., Slack, Github, Discord, Reddit, OpenCollective), and then provides tools for community members to create a wide range of governance policies and automatically carry out those policies on and across their home platforms. She will then conclude with a discussion of specific governance models and how they incorporate legitimacy and accountability in their design.
We had another Science of Community Dialogue! This most recent one was themed around informal learning, talking about communities as informal learning spaces and the sorts of tools and habits communities can adopt to help learners, mentors, and newcomers. We had presentations from Ruijia (Regina) Cheng (University of Washington, CDSC) and Dr. Denae Ford Robinson (Microsoft, University of Washington).
Regina Cheng covered three related research projects and relevant findings:
Ruijia Cheng and Benjamin Mako Hill. 2022. “Many Destinations, Many Pathways: A Quantitative Analysis of Legitimate Peripheral Participation in Scratch.” https://doi.org/10.1145/3555106
Ruijia Cheng, Sayamindu Dasgupta, and Benjamin Mako Hill. 2022. “How Interest-Driven Content Creation Shapes Opportunities for Informal Learning in Scratch: A Case Study on Novices’ Use of Data Structures.” https://doi.org/10.1145/3491102.3502124
Ruijia Cheng and Jenna Frens. 2022. “Feedback Exchange and Online Affinity: A Case Study of Online Fanfiction Writers.” https://doi.org/10.1145/3555127
Participants collaboratively put together three takeaways from Regina Cheng’s presentation.
We often talk about wanting to support “learning” in some general sense, but a critically important question to ask is “learning about what.” Let’s say we want people to learn three things A, B, and C. The kinds of actions or behaviors that support learning goal A often have no effect on B, and C. And sometimes they actively hurt it. We need to be more specific about what we want people to learn because there are tradeoffs.
Social support is wonderful in that users create examples and resources and answer questions. But it also has this narrowing effect. There’s a piling-on effect that makes it easier and easier (and more likely!) to learn the things that folks have learned before and less likely that people learn anything else.
Feedback is not about information transfer, it’s about relationships. To best promote learning, we should create rich, legitimate, inclusive social environment. These are perhaps good things to do anyway.
Dr. Denae Ford Robinson focused on free and open source software (FOSS) communities as a case study of learning communities. She covered theory, needs, and demonstrated tools designed to help with the mentorship and the learning process.
Community-driven settings like FOSS (and social-good oriented projects in particular) rely enormously on volunteers and/or people opting into participation in ways that create huge challenges related to promoting project sustainability: the most active participants are overloaded in a way that is a recipe for burnout.
The path to sustainability involves attracting, retaining, and then sustaining contributions and understanding these processes as both (a) part of the lifecycle of a user and (b) part of a set of dynamics and lifecycle within the community (e.g., dynamics of community growth).
Approach 1 involves providing new information to help maintainers understand how things are going in their communities. A lack of insight and easy access to data is a cause of inefficiency and burnout.
Approach 2 involves making specific, structured recommendations to maintainers based on the experience of others in the past to do things like add tags and to shape behavior.
Approach 3 involves automating aspects of identifying and recognizing work (and perhaps other tasks) as a way of promoting newcomer experiences and reducing the load on maintainers for doing that.
This event and some of the research presented in it were supported by multiple awards from the National Science Foundation (DGE-1842165; IIS-2045055; IIS-1908850; IIS-1910202), Northwestern University, the University of Washington, and Purdue University.
It’s Ph.D. application season and the Community Data Science Collective is recruiting! As always, we are looking for talented people to join our research group. Applying to one of the Ph.D. programs that the CDSC faculty members are affiliated with is a great way to get involved in research on communities, collaboration, and peer production.
Because we know that you may have questions for us that are not answered in this webpage, we will be hosting a panel discussion and Q&A about the CDSC and Ph.D. opportunities on October 20 at 7:30pm UTC (3:30pm US Eastern, 2:30pm US Central, 12:30pm US Pacific). You can register online.
This post provides a very brief run-down on the CDSC, the different universities and Ph.D. programs our faculty members are affiliated with, and some general ideas about what we’re looking for when we review Ph.D. applications.
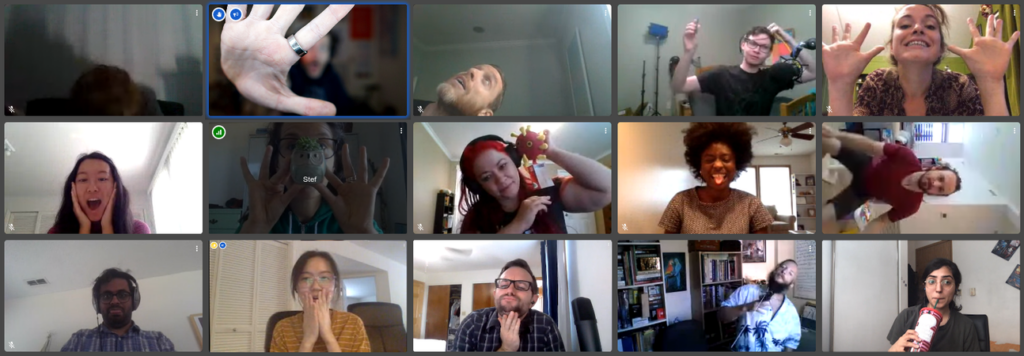
Group photo of the collective at a recent virtual retreat.
What are these different Ph.D. programs? Why would I choose one over the other?
This year the group includes three faculty principal investigators (PIs) who are actively recruiting PhD students: Aaron Shaw (Northwestern University), Benjamin Mako Hill (University of Washington in Seattle), and Jeremy Foote (Purdue University). Each of these PIs advise Ph.D. students in Ph.D. programs at their respective universities. Our programs are each described below.
Although we often work together on research and serve as co-advisors to students in each others’ projects, each faculty person has specific areas of expertise and interests. The reasons you might choose to apply to one Ph.D. program or to work with a specific faculty member could include factors like your previous training, career goals, and the alignment of your specific research interests with our respective skills.
At the same time, a great thing about the CDSC is that we all collaborate and regularly co-advise students across our respective campuses, so the choice to apply to or attend one program does not prevent you from accessing the expertise of our whole group. But please keep in mind that our different Ph.D. programs have different application deadlines, requirements, and procedures!
Who is actively recruiting this year?
If you are interested in applying to any of the programs, we strongly encourage you to reach out the specific faculty in that program before submitting an application.
Ph.D. Advisors
Benjamin Mako Hill
Benjamin Mako Hill is an Associate Professor of Communication at the University of Washington. He is also an Adjunct Assistant Professor at UW’s Department of Human-Centered Design and Engineering (HCDE), Computer Science and Engineering (CSE) and Information School. Although many of Mako’s students are in the Department of Communication, he has also advised students in all three other departments—although he typically has more limited ability to admit students into those programs on his own and usually does so with a co-advisor in those departments. Mako’s research focuses on population-level studies of peer production projects, computational social science, efforts to democratize data science, and informal learning. Mako has also put together a webpage for prospective graduate students with some useful links and information..
AaronShaw is an Associate Professor in the Department of Communication Studies at Northwestern. This year, he’s also the “Scholar in Residence” for King County, Washington. In terms of Ph.D. programs, Aaron’s primary affiliations are with the Media, Technology and Society (MTS) and the Technology and Social Behavior (TSB) Ph.D. programs (please note: the TSB program is a joint degree between Communication and Computer Science). Aaron also has a courtesy appointment in the Sociology Department at Northwestern, but he has not directly supervised any Ph.D. advisees in that department (yet). Aaron’s current projects focus on comparative analysis of the organization of peer production communities and social computing projects, participation inequalities in online communities, and collaborative organizing in pursuit of public goods.
Jeremy Foote
Jeremy Foote is an Assistant Professor at the Brian Lamb School of Communication at Purdue University. He is affiliated with the Organizational Communication and Media, Technology, and Society programs. Jeremy’s current research focuses on how individuals decide when and in what ways to contribute to online communities, how communities change the people who participate in them, and how both of those processes can help us to understand which things become popular and influential. Most of his research is done using data science methods and agent-based simulations.
What do you look for in Ph.D. applicants?
There’s no easy or singular answer to this. In general, we look for curious, intelligent people driven to develop original research projects that advance scientific and practical understanding of topics that intersect with any of our collective research interests.
To get an idea of the interests and experiences present in the group, read our respective bios and CVs (follow the links above to our personal websites). Specific skills that we and our students tend to use on a regular basis include consuming and producing social science and/or social computing (human-computer interaction) research; applied statistics and statistical computing, various empirical research methods, social theory and cultural studies, and more.
Formal qualifications that speak to similar skills and show up in your resume, transcripts, or work history are great, but we are much more interested in your capacity to learn, think, write, analyze, and/or code effectively than in your credentials, test scores, grades, or previous affiliations. It’s graduate school and we do not expect you to show up knowing how to do all the things already.
Intellectual creativity, persistence, and a willingness to acquire new skills and problem-solve matter a lot. We think doctoral education is less about executing tasks that someone else hands you and more about learning how to identify a new, important problem; develop an appropriate approach to solving it; and explain all of the above and why it matters so that other people can learn from you in the future. Evidence that you can or at least want to do these things is critical. Indications that you can also play well with others and would make a generous, friendly colleague are really important too.
All of this is to say, we do not have any one trait or skill set we look for in prospective students. We strive to be inclusive along every possible dimension. Each person who has joined our group has contributed unique skills and experiences as well as their own personal interests. We want our future students and colleagues to do the same.
Now what?
Still not sure whether or how your interests might fit with the group? Still have questions? Still reading and just don’t want to stop? Follow the links above for more information. Feel free to send at least one of us an email. We are happy to try to answer your questions and always eager to chat. You can also join our panel discussion on October 20 at 3:30pm ET (UTC-5).
We recently held our second Community Dialogue around the theme of anonymity and privacy. Kaylea Champion presented on the role of anonymity in peer-contribution communities. Dr. Shruti Sannon joined us from the University of Michigan and talked about privacy in the gig economy.
What’s Anonymity Worth (Kaylea Champion)
Anonymity can protect and empower contributors in communities. Anonymity can make people feel safer or actually be safer. For example: Wikipedia editors who are working on controversial pages within contested geographies may be safer when they are able to contribute anonymously. Anonymous contribution is not without problems, as it can also empower trolls, harassers, and other bad actors. For more details, and actions you can take or policies to recommend within your communities, watch the video of Kaylea Champion’s presentation below.
Privacy and Surveillance in the Gig Economy (Dr. Shruti Sannon)
Gig workers can be asked or coerced to give up privacy in exchange for money through the design of the gig platforms they are using or by request of customers. Gig workers also use surveillance tools as a means of protecting themselves — some ride share drivers have cameras in their cars for this purpose. Dr. Sannon shared the broader implications of this situation, and what it can mean outside of the gig economy. To learn more, watch the video below.
Join us!
You can subscribe to our mailing list! We’ll be making announcements about future events there. It is a low volume mailing list.
Acknowledgements
Thanks to speakers Kaylea Champion and Shruti Sannon. The vision for this event borrows from the User and Open Innovation workshops organized by Eric von Hippel and colleagues, as well as others. This event and the research presented in it were supported by multiple awards from the National Science Foundation (DGE-1842165; IIS-2045055; IIS-1908850; IIS-1910202), Northwestern University, the University of Washington, and Purdue University.
This winter, the Community Data Science Collective launched a Community Dialogues series. These are meetings in which we invite community experts, organizers, and researchers to get together to share their knowledge of community practices and challenges, recent research, and how that research can be applied to support communities. We had our first meeting in February, with presentations from Jeremy Foot and Sohyeon Hwang on small communities and Nate TeBlunthius and Charlie Keine on overlapping communities.
Here are some quick summaries of the presentations. After the presentations, we formed small groups to discuss how what we learned related to our own experiences and knowledge of communities.
Finding Success in Small Communities
Small communities often stay small, medium stay medium, and big stay big. Meteoric growth is uncommon. User control and content curation improves user experience. Small communities help people define their expectations. Participation in small communities is often very salient and help participants build group identity, but not personal relationships. Growth doesn’t mean success, and we need to move beyond that and solely using quantitative metrics to judge our success. Being small can be a feature, not a bug!
We built a list of discussion questions collaboratively. It included:
Are you actively trying to attract new members to your community? Why or why not?
How do you approach scale/size in your community/communities?
Do you experience pressure to grow? From where? Towards what end?
What kinds of connections do people seek in the community/communities you are a part of?
Can you imagine designs/interventions to draw benefits from small communities or sub-communities within larger projects/communities?
How to understand/set community members’ expectations regarding community size?
“Small communities promote group identity but not interpersonal relationships.” This seems counterintuitive.
How do you managing challenges around growth incentives/pressures?
Why People Join Multiple Communities
People join topical clusters of communities, which have more mutualistic relationships than competitive ones. There is a trilemma (like a dilemma) between large audience, specific content, and homophily (likemindness). No community can do everything, and it may be better for participants and communities to have multiple, overlapping spaces. This can be more engaging, generative, fulfilling, and productive. People develop portfolios of communities, which can involve many small communities..
Questions we had for each other:
Do members of your community also participate in similar communities?
What other communities are your members most often involved in?
Are they “competing” with you? Or “mutualistic” in some way?
In what other ways do they relate to your community?
There is a “trilemma” between the largest possible audience, specific content, and homophilous (likeminded/similar folks) community. Where does your community sit inside this trilemma?
You can subscribe to our mailing list! We’ll be making announcements about future events there. It will be a low volume mailing list.
Acknowledgements
Thanks to speakers Charlie Kiene, Jeremy Foote, Nate TeBlunthius, and Sohyeon Hwang! Kaylea Champion was heavily involved in planning and decision making. The vision for the event borrows from the User and Open Innovation workshops organized by Eric von Hippel and colleagues, as well as others. This event and the research presented in it were supported by multiple awards from the National Science Foundation (DGE-1842165; IIS-2045055; IIS-1908850; IIS-1910202), Northwestern University, the University of Washington, and Purdue University.
Session summaries and questions above were created collaboratively by event attendees.
Thinking about applying to graduate school? Wonder what it’s like to pursue a PhD? Interested in understanding relationships between technology and society? Curious about how to do research on online communities like Reddit, Wikipedia, or GNU/Linux? The Community Data Science Collective is hosting a Q&A on November 5th at 13:00 ET / 12:00 CT / 10:00 PT for prospective students. This session is scheduled for an hour, to be divided between a larger group session with faculty and then smaller groups with current graduate students.
This is an opportunity for prospective grad students to meet with CDSC faculty, students, and staff. We’ll be there to answer any questions you have about the group, the work we do, your applications to our various programs, and other topics. You can either submit a question ahead of time or ask one during the session.
About the CDSC
We are an interdisciplinary research group spread across Carleton, Northwestern University, Purdue University, and the University of Washington. (Carleton is not accepting graduate students, though the other universities are.) You can read more about PhD opportunities on our blog.
We are mostly quantitative social scientists pursuing research about the organization of online communities, peer production, online communities, and learning and collaboration in social computing systems. Our group research blog and publications page can tell you more about our work.
Notes About Attending
We are so excited to meet you! Please RSVP online to let us know if you’re coming. This form also gives you the opportunity to ask a question ahead of time. By doing this, we’ll be able to make sure we get to your questions.
We will post another announcement with attendance information. We will also email attendance details to all registered attendees.
Workshop Report From Connected Learning Summit 2021
What are data literacies? What should they be? How can we best support youth in developing them via future tools? On July 13th and July 15th 2021, we held a two-day workshop at the Connected Learning Summit to explore these questions. Over the course of two very-full one-hour sessions, 40 participants from a range of backgrounds got to know each other, shared their knowledge and expertise, and engaged in brainstorming to identify important pressing questions around youth data literacies as well as promising ways to design future tools to support youth in developing them. In this blog post, we provide a full report from our workshop, links to the notes and boards we created during the workshop, and a description of how anyone can get involved in the community around youth data literacies that we have begun to build.
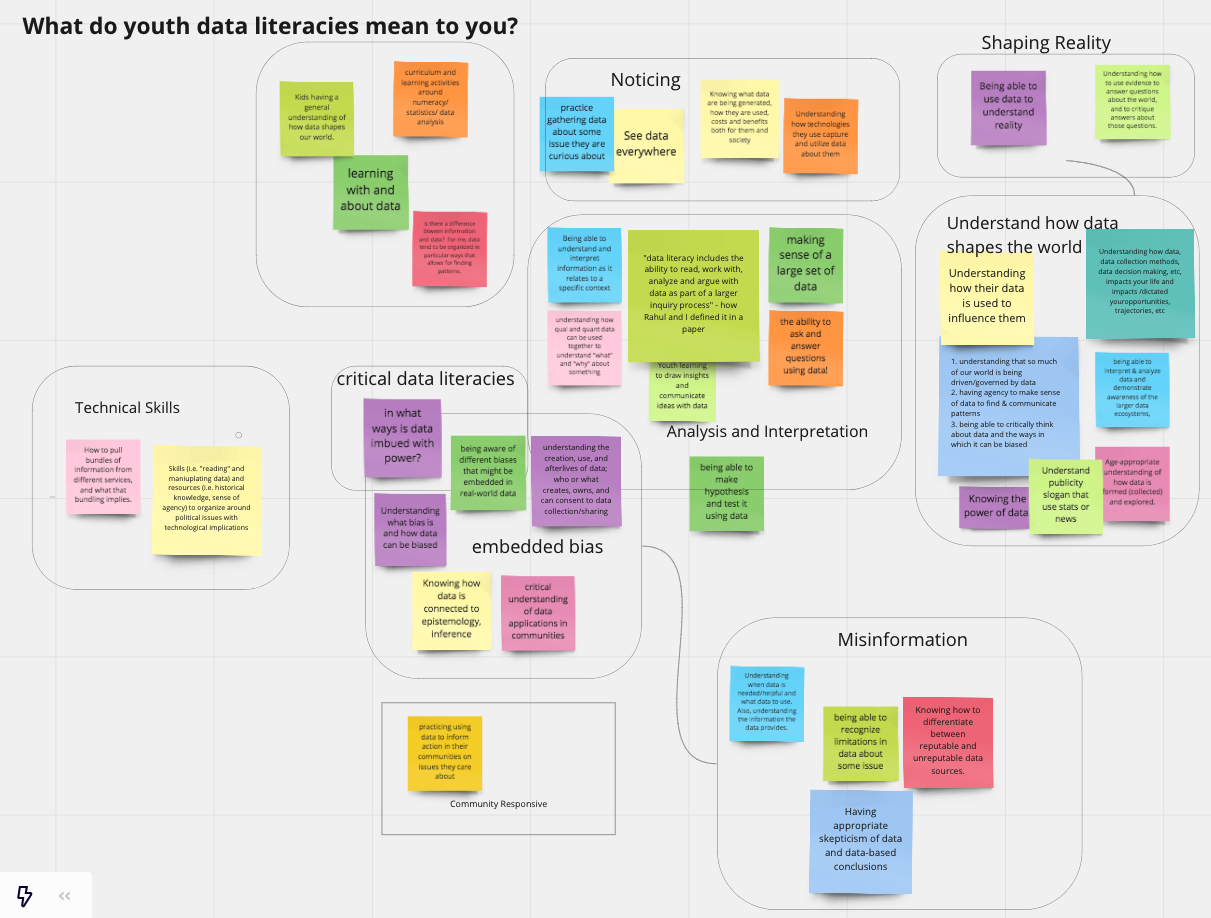
Caption: We opened our sessions by encouraging participants to share and synthesize what youth data literacies meant to them. This affinity diagram is the result.
How this workshop came to be
As part of the research team interested in research about learning at the Community Data Science Collective, we have long been fascinated with how youth and adults learn how to ask and answer questions with data While we have engaged with these questions ourselves by looking to Scratch and Cognimates, we are always curious about how we might design tools to promote youth data literacies in the future in other contexts.
The Connected Learning Summit is a unique gathering of practitioners, researchers, teachers, educators, industry professionals, and others, all interested in formal and informal learning and the impact of new media on current and future communities of learners. When the Connected Learning Summit put up a call for workshops, we thought this was a great opportunity to engage the broader community on the topic of youth data literacies.
Several months ago, the four of us (Stefania, Regina, Emilia and Mako) started to brainstorm ideas for potential proposals. We started by listing potential aspects and elements of data literacies such as: finding & curating data, visualizing & analyzing it, programming with data, and engaging in critical reflection. We then started to identify tools that can be used to accomplish each goal and tied to identify opportunities and gaps. See some examples of these tools on our workshop website.
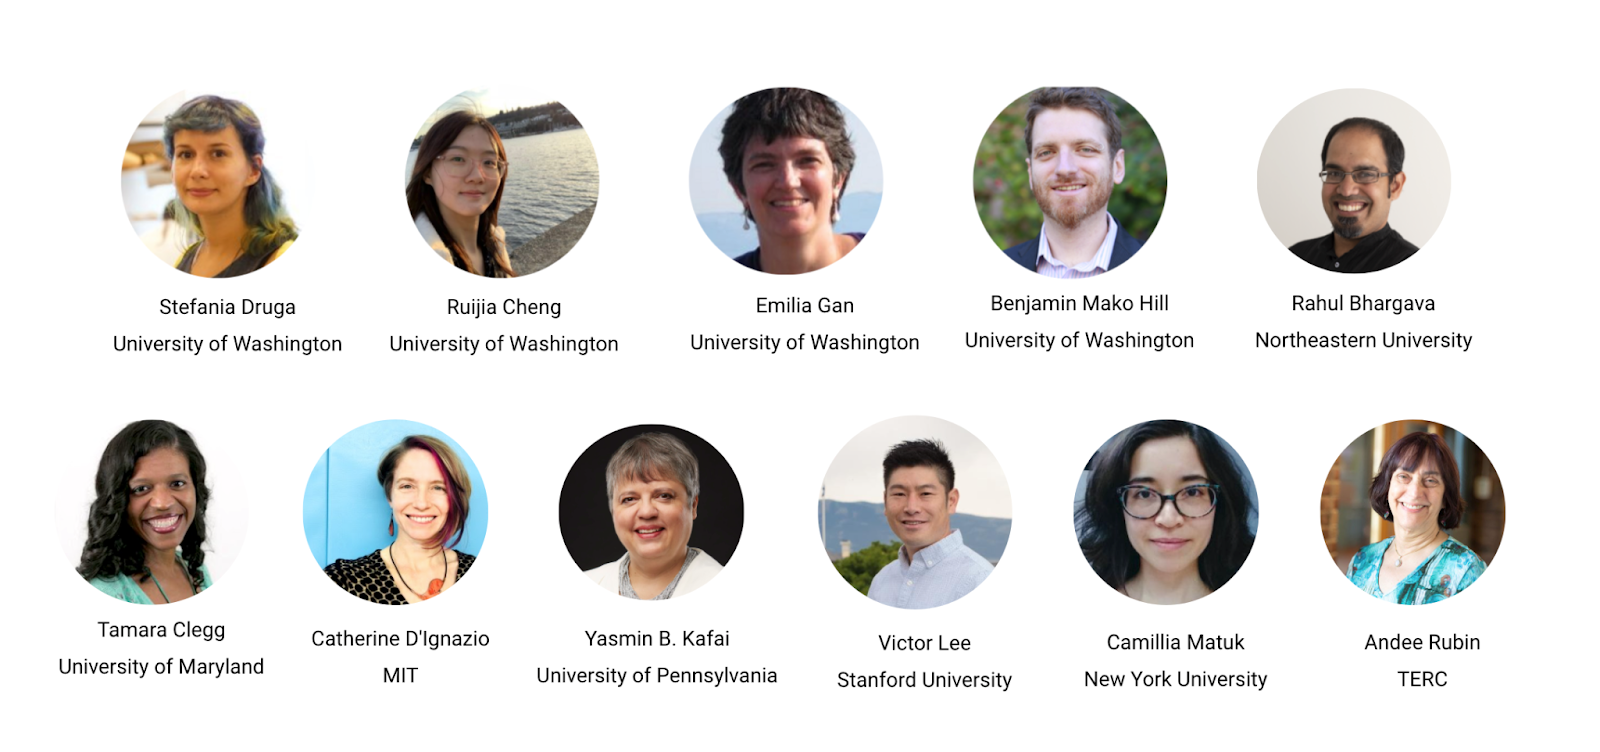
As part of this process, we identified a number of leaders in the space. This included people who have built tools like Rahul Bhargava and Catherine D’Ignazio who designed Databasic.io,Andee Rubinwho contributed to CODAP, and Victor Lee who focused on tools that link personal informatics and data. Other leaders included scholars who researched how existing tools are being used to support data literacies, including Tammy Clegg who has researched how college athletes develop data literacy skills, Yasmin Kafai who has looked at e-textile projects, and Camillia Matuk who has done research on data literacy curricula. Happily, all of these leaders agreed to join us as co-organizers for the workshop.
The workshop and what we learned from it
Our workshop took place on July 13th and July 15th as part of the 2021 Connected Learning Summit. Participants came from diverse backgrounds and the group included academic researchers, industry practitioners, K-12 teachers, and librarians. On the first day we focused on exploring existing learning scenarios designed to promote youth data literacies. On the second day we built on big questions raised in the initial session and brainstormed features for future systems. Both workshop sessions were composed of several breakout sessions. We took notes in a shared editor and encouraged participants to add their ideas and comments on sticky notes on collaborative digital white boards and share their definitions and questions around data literacies.
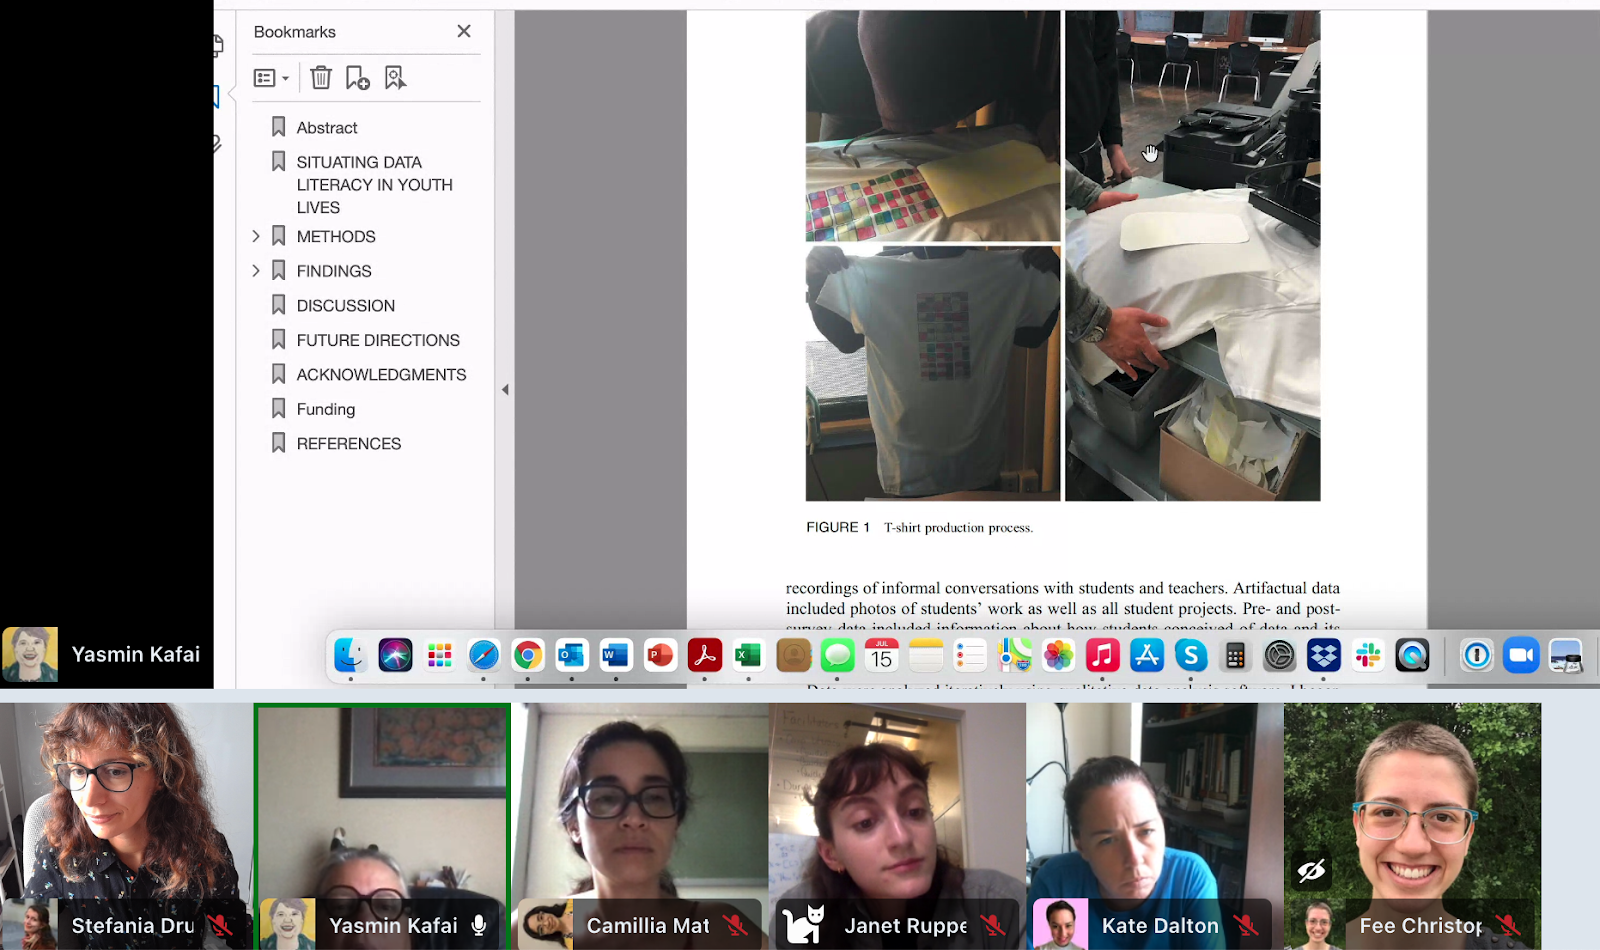
Caption: organizers and participants sharing past projects and ideas in a breakout session.
Day 1 Highlights
On Day 1, we explored a variety of existing tools designed to promote youth data literacies. We had a total of 28 participants who attended the session. We began with a group exercise where we shared their own definitions of youth data literacies before dividing into 3 groups: a group focusing on tools for data visualization and storytelling, a group focusing on block-based tools, and a group focusing on data literacy curricula. In each breakout session, our co-organizers first demonstrated one or two existing tools. Each group then discussed how the demo tool might support a single learning scenario based on the following prompt: “Imagine a six-grader who just learned basic concepts about central tendency, how might she use these tools to apply this concept on real world data?” Each group generated many reflective questions and ideas that would prompt and help inform the design of future data literacies tools. Results of our process are captured in the boards linked below.
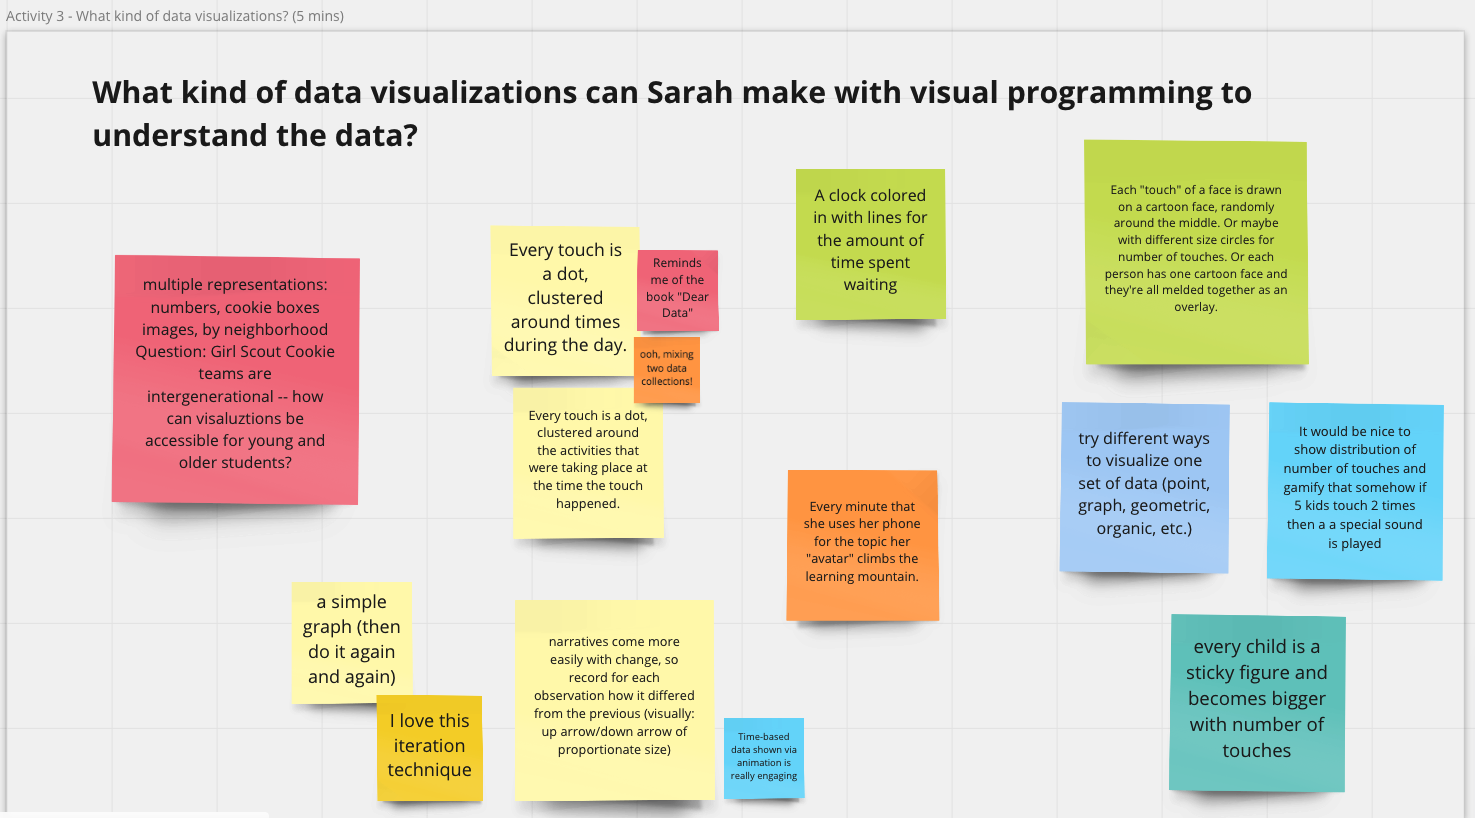
Caption: Activities on Miro boards during the workshop.
Data visualization and storytelling
Click here to see the activities on Miro board for this breakout session.
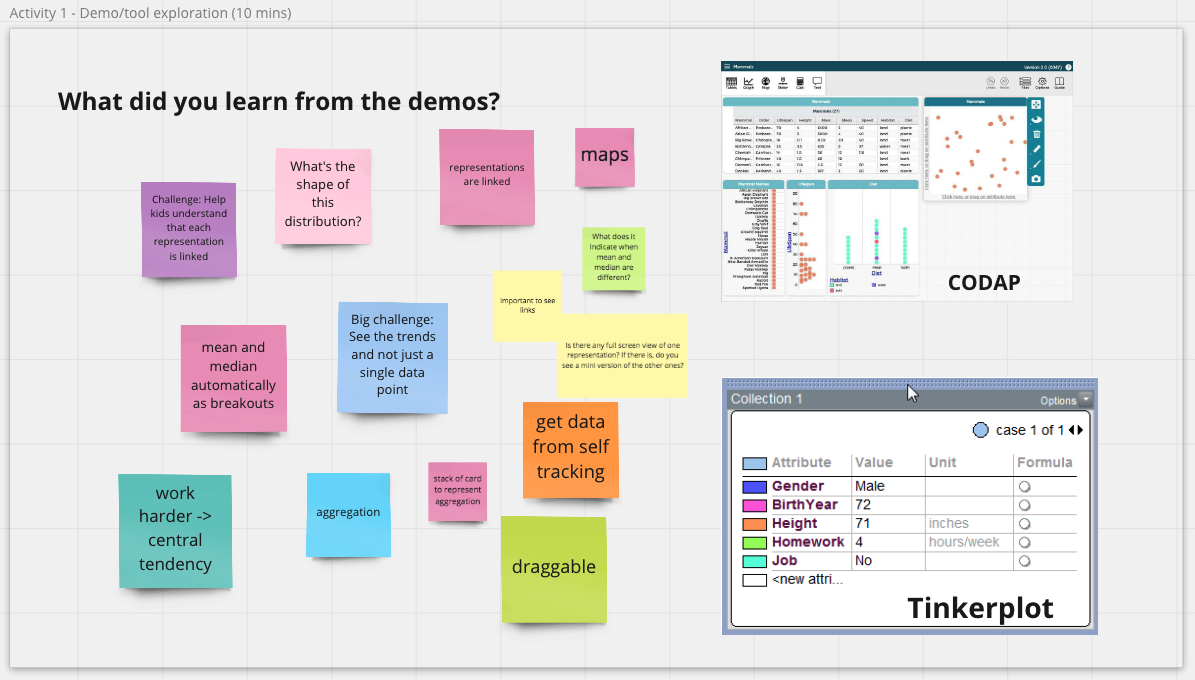
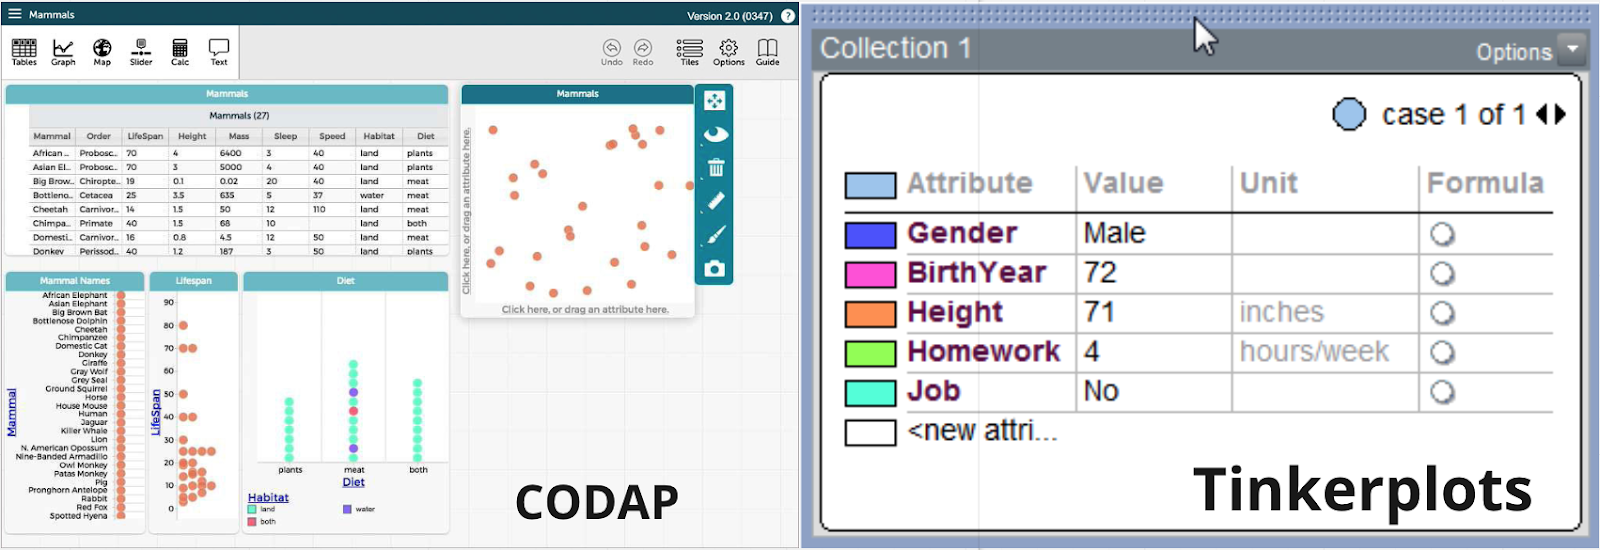
In the sub-section focusing on data visualization and storytelling, Victor Lee first demonstrated Tinkerplots, a desktop-based software that allows students to explore a variety of visualizations with simple click-button interaction using data in .csv format. Andee Rubin then demonstrated CODAP, a web-based tool similar to Tinkerplots that supports drag-and-drop with data, additional visual representation options including maps, and connection between representations.
Caption: CODAP and Tinkerplots—two tools demonstrated during the workshop.
We discussed how various features of these tools could support youth data literacies in specific learning scenarios. We saw flexibility as one of the most important factors in tool use, both for learners and teachers. Both tools are topic-agnostic and compatible with any data in .csv format. This allows students to explore data of any topics that interest them. Simplicity in interaction is another important advantage. Students can easily see the links between tabular data and visualizations and try out different representations using simple interactions like drag-and-drop, check boxes, and button clicks. Features of these tools can also support students in performing aggregation on data and telling stories about trends and outliers.
We further discussed potential learning needs beyond what the current features could support. Before creating visualizations, students may need scaffolds during the process of data collection, as well as in the stage of programming with and preprocessing data. Story telling about the process of working with data was another theme that came up a lot from our discussion. Open questions include how features can be designed to support reproducibility, how we can design scaffolds for students to explain what they are doing with data in diary style stories, and how we can help students narrate what they think about a dataset and why they generate particular visualizations.
Block-based tools
Click here to see the activities on Miro board for this breakout session.
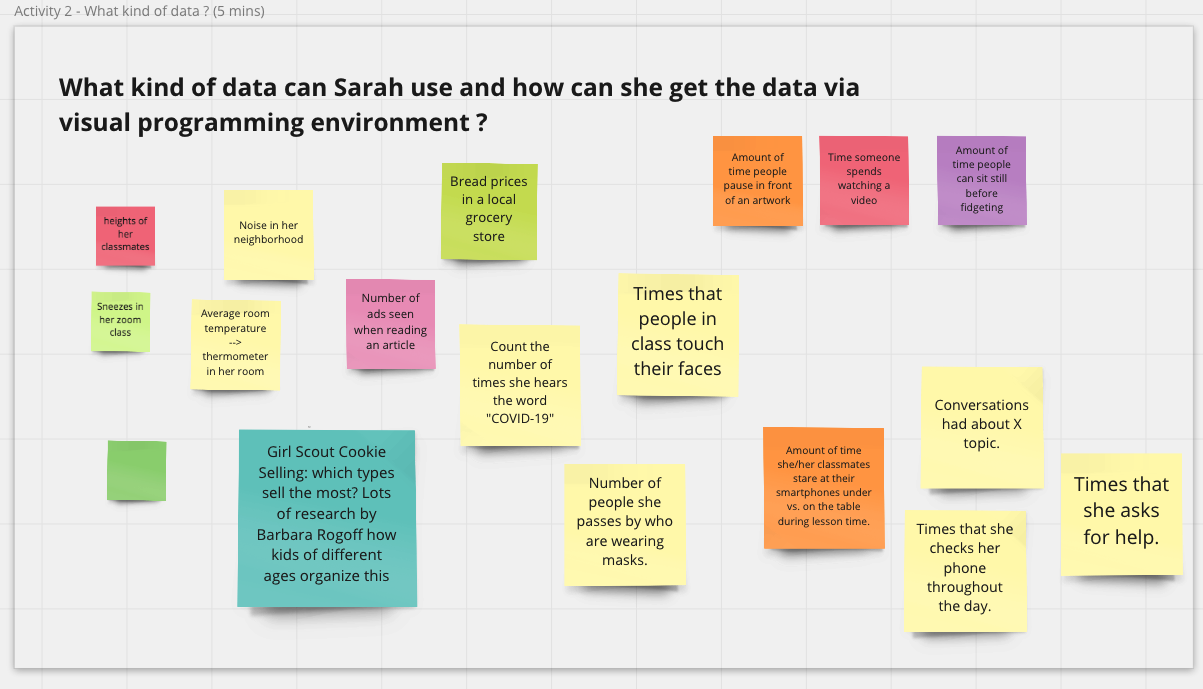
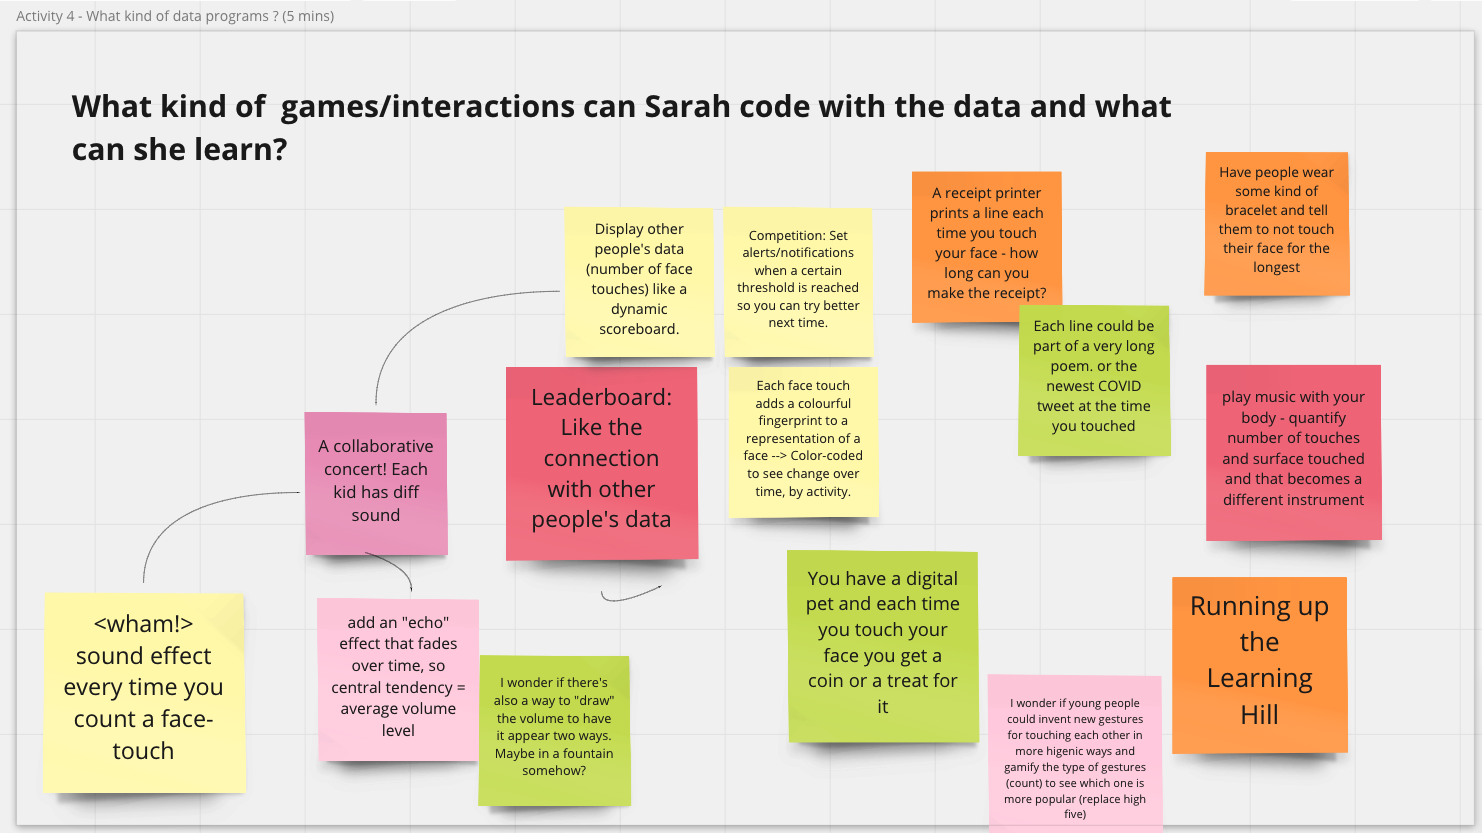
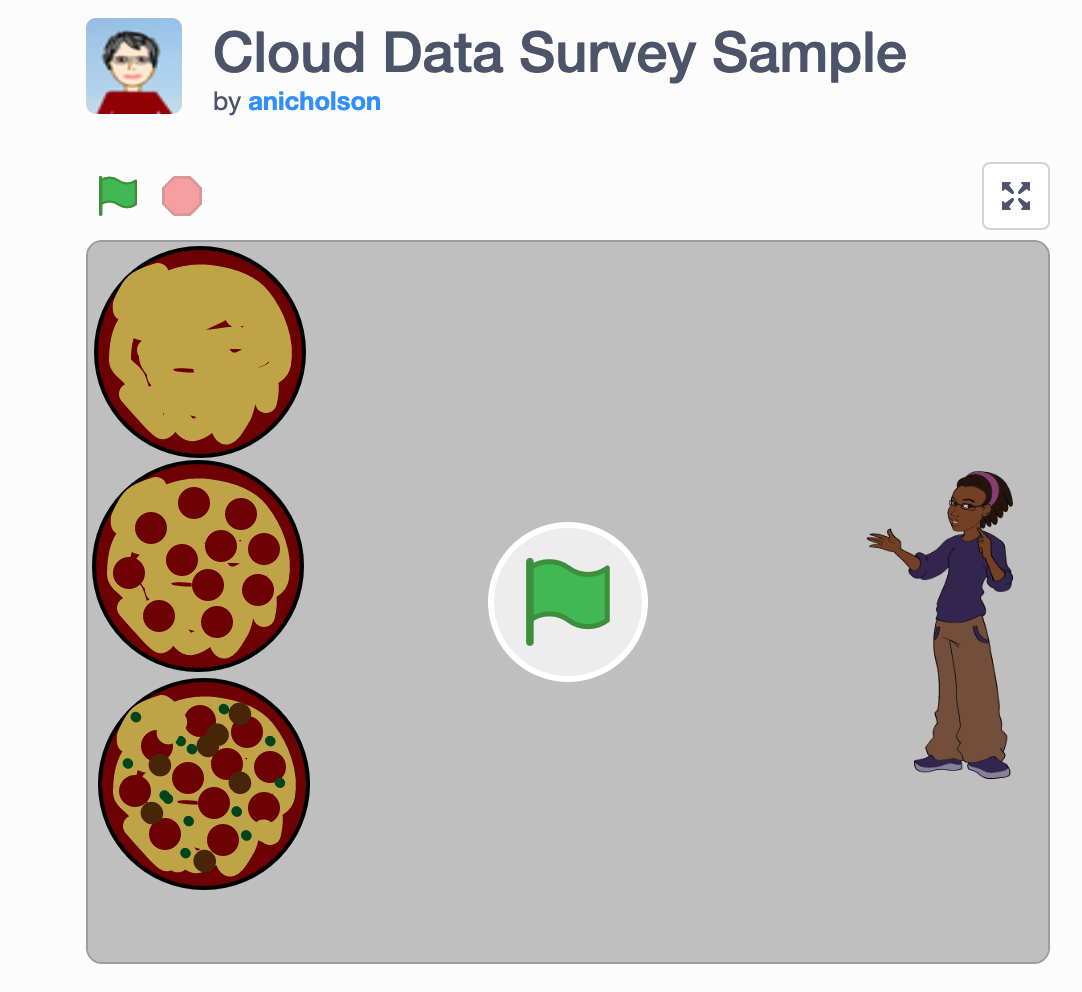
The breakout section about block-based tools started with PhD candidate Stefania Druga demonstrating a program in Scratch and how users could interact with data using the Scratch Cloud Data. We brainstormed about the kind of data students could collect and explore and the kind of visualization, game-based, or other creative interactions youth could create with the help of block-based tools. As a group, we came up with many creative ideas. For example, students can collect and visualize “the newest COVID tweet at the time you touched” a sensor and make “sound effect every time you count a face-touch.”
Caption: A Scratch project demonstrated during the workshop made with Cloud Data.
We discussed how interaction with data was part of an enterprise that is larger than any particular digital scaffold. After all, data exploration is embedded in social context and might reflect hot topics and recent trends. For instance, many of our ideas about data explorations were around COVID-19 related data and topics.
Our group also felt that interaction with data should not be limited to a single digital software. Many scenarios we came up with were centered on personal data collection in physical spaces (e.g., counting the number of times a student touches their own face). This points to a future design direction of how we can connect multiple tools that support interaction in both digital and physical spaces and encourage students to explore questions using different tools.
A final theme from our discussion was around how we can use block-based tools to allow engagement with data among a wider audience. For example, accessible and interesting activities and experience with block-based tools could be designed so that librarians can get involved in meaningful ways to introduce people to data.
Data literacy curriculum
Click here to see the activities on Miro board for this breakout session.
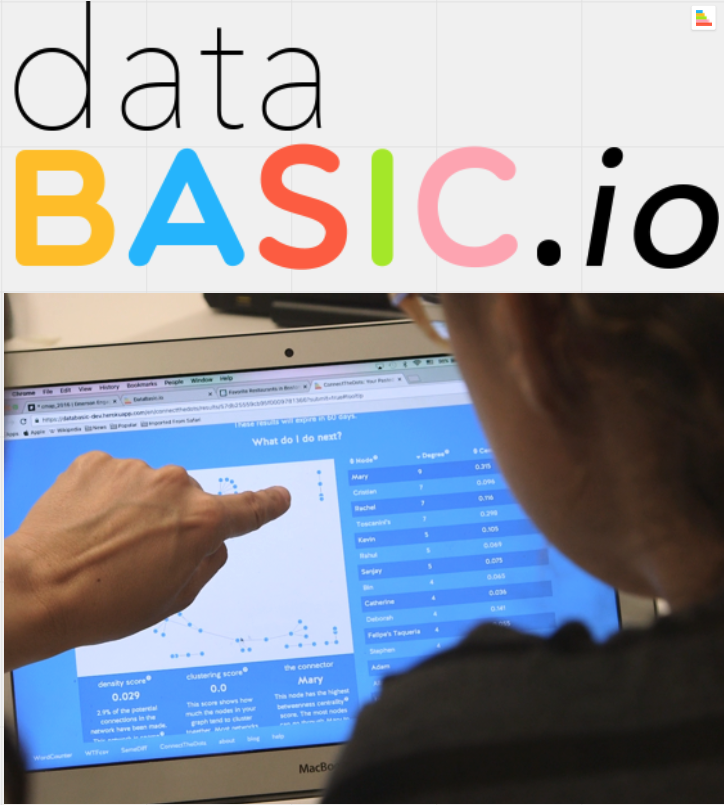
In the breakout section emphasizing on curriculum design, we started with an introduction by Catherine D’Ignazio and Rahul Bhargava on DataBasic.io’s Word Counter: a tool that allows users to paste in text to see word counts in various ways. We also walked through some curricula that the team created to guide students through the process of telling stories with data.
We talked about how this design was powerful in that it allows students to bring their own data and context, and to share knowledge about what they expect to find. Some of the scenarios we imagined included students analyzing their own writings, favorite songs, and favorite texts, and how they might use data to tell personalized stories from there. The specificity of the task supported by the tool enables students to deepen concepts about data by asking specific questions and looking at different datasets to explore the same question.
Caption: dataBASIC.io helps users explore data.
We also reflected on the fact that tools provided in Databasic.io are easy to use precisely because they are quite narrowly focused on a specific analytic task. This is a major strength of the tools, as they are intended as transitional bridges to help users develop foundational skills for data analysis. Using these tools should help answer questions, but should also encourage users to ask even more.
This led to a new set of issues discussed during the breakout session: How do we chain collections of small tools that might serve as one part of a data literacies pipeline together? This is where we felt curricular design could really come into play. Rather than having tools that try to “be everything,” using well-designed tools that address one aspect of an analysis can provide more flexibility and freedom to explore. Our group felt that curriculum can help learners reach the most important step in their learning, going from data to story to the bigger world—and to understanding why the data might matter.
Day 2 Highlights
The goal for the Day 2 of our workshop was to speculate and brainstorm future designs of tools that support youth data literacies. After our tool exploration and discussions on Day 1, three interesting brainstorming questions emerged across the breakout sections described above:
How can we close the gap between general purpose tools and specific learning goals?
How can we support storytelling using data?
How can we support insights into the messiness of data and hidden decisions
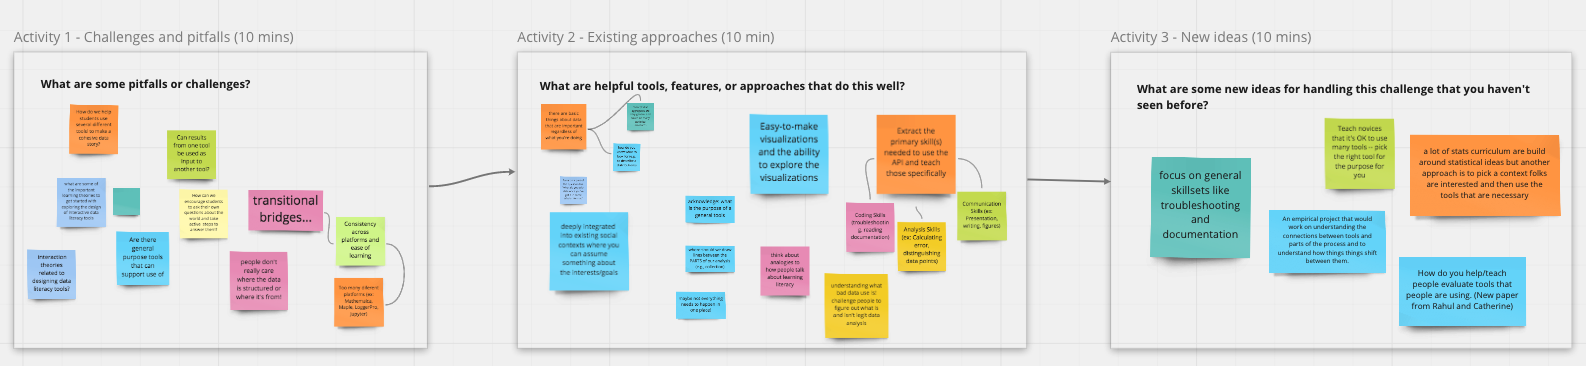
We focused on discussing these questions on Day 2. A total of 29 participants attended and we once again divided into breakout groups based on the three questions above. For each brainstorming question, we considered the key questions in terms of the following three sub-questions: What are some helpful tools or features that can help answer the question? What are some pitfalls? And what new ideas can we come up with?
Caption: Workshop activities generated an abundance of ideas.
How can we close the gap between general purpose tools and specific learning goals?
Click here to see the activities on Miro board for this breakout session.
Often tools designed to solve a range of potential problems. That said, learners attempting to engage in data analysis are frequently faced with extremely specific questions about their analysis and datasets. Where does their data come from? How is it structured? How can it be collected? How do we balance the desire to serve many specific learners’ goals with general tools against the desire to handle specific challenges well?
As one approach, we drew lines between different parts of doing data analysis and frequently required features in different tools. Of course, data analysis is rarely a simple linear process. We also concluded that perhaps not everything needs to happen in one place or with one tool, and that this should be acknowledged and considered during the design process. We also discussed the importance of providing context within more general data analytic tools. We also talked about how learners need to think about the purpose of their analysis before they consider what tool to use and how, ideally, youth would learn to see patterns in data and to understand the significance of the patterns they find. Finally, we agreed that tools that help students understand the limitations of data and the uncertainty inherent in the data are also important.
Challenges and opportunities for telling stories with data
Click here to see the activities on Miro board for this breakout session.
In this section, we discussed challenges and opportunities around supporting students to tell stories with data. We talked about enabling students to recognize and represent the backstory of data. Open questions included: How do we make sure learners are aware of bias? And how can we help people recognize and document the decision of what to include and exclude?
As for telling stories about students’ own experience of working with data, collaboration was also a topic that came up frequently. We agreed that narrative with data is never an individual process. We discussed that future tools should be designed to support critique, iteration, and collaboration among storytellers, audiences, and maybe also between tellers and audiences.
Finally, we talked about future directions. This included taking a crowdsourced, community-driven approach to tell stories with data. We also noted that we had seen a lot of research effort to support storytelling about data in visualization systems or computational notebooks. We agreed that storytelling should not be limited to digital format and speculated that future designs could extend the storytelling process to unplugged, physical activities. For example, we can design to encourage students to create artefacts and monuments as part of the data storytelling process. We also talked about designing to engage people from diverse backgrounds and communities to contribute to and explore data together.
Challenges and opportunities for helping students to understand the messiness of data
Click here to see the activities on Miro board for this breakout session.
In this section, we talked about the tension between the need to make data clean and easy to use for students and the need to let youth understand the messiness of real world data. We shared our own experiences helping students engage with real or realistic data. A common way is to engage students in collaborative data production and have them compare the outcomes of a similar analysis between each other. For instance, students can document their weekly groceries and find that different people record the same items under different names. They can then come up with a plan to name things consistently and clean their data.
One very interesting point that came up from our discussion was what we really mean by “messy data.” “Messy,” incomplete, or inconsistent data may be unusable for computers while still comprehensible by humans. Therefore to be able to work with messy data does not only mean to have the skills to preprocess, but also involve the recognition of hidden human decisions and assumptions.
We came up with many ideas regarding future system design. We suggested designing to support crowdsourced data storytelling. For example, students can each contribute a small piece of documentation about the background of a dataset. Features might also be designed to support students to collect and represent the backstory of data in innovative ways. For example, functions that support the generation of rich media, such as videos, drawings, journal entries, can be embedded into data representation systems. We might also innovate on the way we design the interface of data storage so that students can interact with rich background information and metadata while still keeping the data “clean” for computation.
Next steps & community
We intend for this workshop to be only the beginning of our learning and exploration in the space of youth data literacies. We also hope to continue building the community we built. In particular, we have started a mailing list where we can continue our ongoing discussion. Please feel free to add yourself to the mailing list if you would like to be kept informed about our ongoing activities.
Although the workshop has ended, we have included links to many resources on the workshop website, and we invite you to explore the site. We also encourage you to contribute to a crowdsourced list of papers on data literacies by filling out this form.
This blog was collaboratively written by Regina Cheng, Stefania Druga, Emilia Gan, and Benjamin Mako Hill.
Stefania Druga is a PhD candidate in the Information School at University of Washington. Her research centers on AI literacy for families and designing tools for interest-based creative coding. In her most recent project, she focuses on building a platform that leverages youth creative confidence via coding with AI agents.
Regina Cheng is a PhD candidate in the Human Centered Design and Engineering department at University of Washington. Her research centers on broadening and facilitating participation in online informal learning communities. In her most recent work, she focuses on designing for novices’ engagement with data in online communities.
Emilia Gan is a graduate student in the Paul G. Allen School of Computer Science and Engineering (UW-Seattle). Her research explores factors that lead to continued participation of novices in computing.
Benjamin Mako Hill is an Assistant Professor at UW. His research involves democratizing data science—and doing it from time to time as well.
If you are at the University of Washington (or not at UW but in Seattle) and are interested in seeing what we’re up to, you can join us for a Community Data Science Collective “open lab” this Friday (April 6th) 3-5pm in our new lab space (CMU 306). Collective members from Northwestern University will be in town as well, so there’s even more reason to come!
The open lab is an opportunity to learn about our research, catch up over snacks and beverages, and pick up a sticker or two. We will have no presentations but several posters describing projects we are working on.
Give students a basic understanding of how to do some fundamental data analysis tasks in R: importing, cleaning, visualizing, and modeling
Those are really big goals for only four hours. I decided to use the tidyverse as much as possible and not even teach base R syntax like ‘[,]’, apply, etc. I used the first session to show and explain code using the nycflights13 dataset. For the the second session we did a few more examples but mostly worked on exercises using a dataset from Wikia that I created (with help from Mako and Aaron Halfaker‘s code and data).
Learning R does have its downsides
Retrospection
Overall, I think that the workshops went pretty well. I think that students definitely have a better understanding and a better set of tools than I did after I had used R for four hours!
That being said, there was plenty of room for improvement. I am scheduled to teach another set of workshops early next year and I’m planning to make a few changes:
Make both of the workshops more hands-on and interactive. I think I’ll divide the topics covered: the first workshop will be on importing, cleaning, and grouping data and the second will be on visualizing and creating inferential models.
Get more help – teaching non-programmers R requires some hand-holding and individual attention. To be successful, I think a workshop like this requires 1 “TA” for every 8-10 students.
Find a more relevant dataset. Although I actually learned a few things about my dataset that will help with my papers that use it, I think it would be better to have a dataset that is as similar as possible to what students will be working with in their careers.
Connect the visualization and regression more directly to a specific analysis problem rather than as syntax-learning exercises.
Reuse this workshop!
I found some pretty good resources already in existence for introducing students to R, but none of them quite fit the scope of what I was looking for. All of the code that I used (as well as some slides for the beginning of class) are on github and GPL licensed. Please reuse my work and submit pull requests!