How does Interest-driven Participation Shape Computational Learning in Online Communities?

Online communities are frequently described as promising sites for computing education. Advocates of online communities as contexts for learning argue that they can help novices learn concrete programming skills through self-directed and interest-driven work. Of course, it is not always clear how well this plays out in practice—especially when it comes to learning challenging programming concepts. We sought to understand this process through a mixed-method case study of the Scratch online community that will be published and presented at the ACM Conference on Human Factors in Computing (CHI 2022) in several weeks.

Scratch is the largest online interest-driven programming community for novices. In Scratch, users can create programming projects using the visual-block based Scratch programming language. Scratch users can choose to share their projects—and many do—so that they can be seen, interacted with, and remixed by other Scratch community members. Our study focused on understanding how Scratch users learn to program with data structures (i.e., variables and lists)—a challenging programming concept for novices—by using community-produced learning resources such as discussion threads and curated project examples. Through a qualitative analysis on Scratch forum discussion threads, we identified a social feedback loop where participation in the community raises the visibility of some particular ways of using variables and lists in ways that shaped the nature and diversity of community-produced learning resources. In a follow-up quantitative analysis on a large collection of Scratch projects, we find statistical support for this social process. 
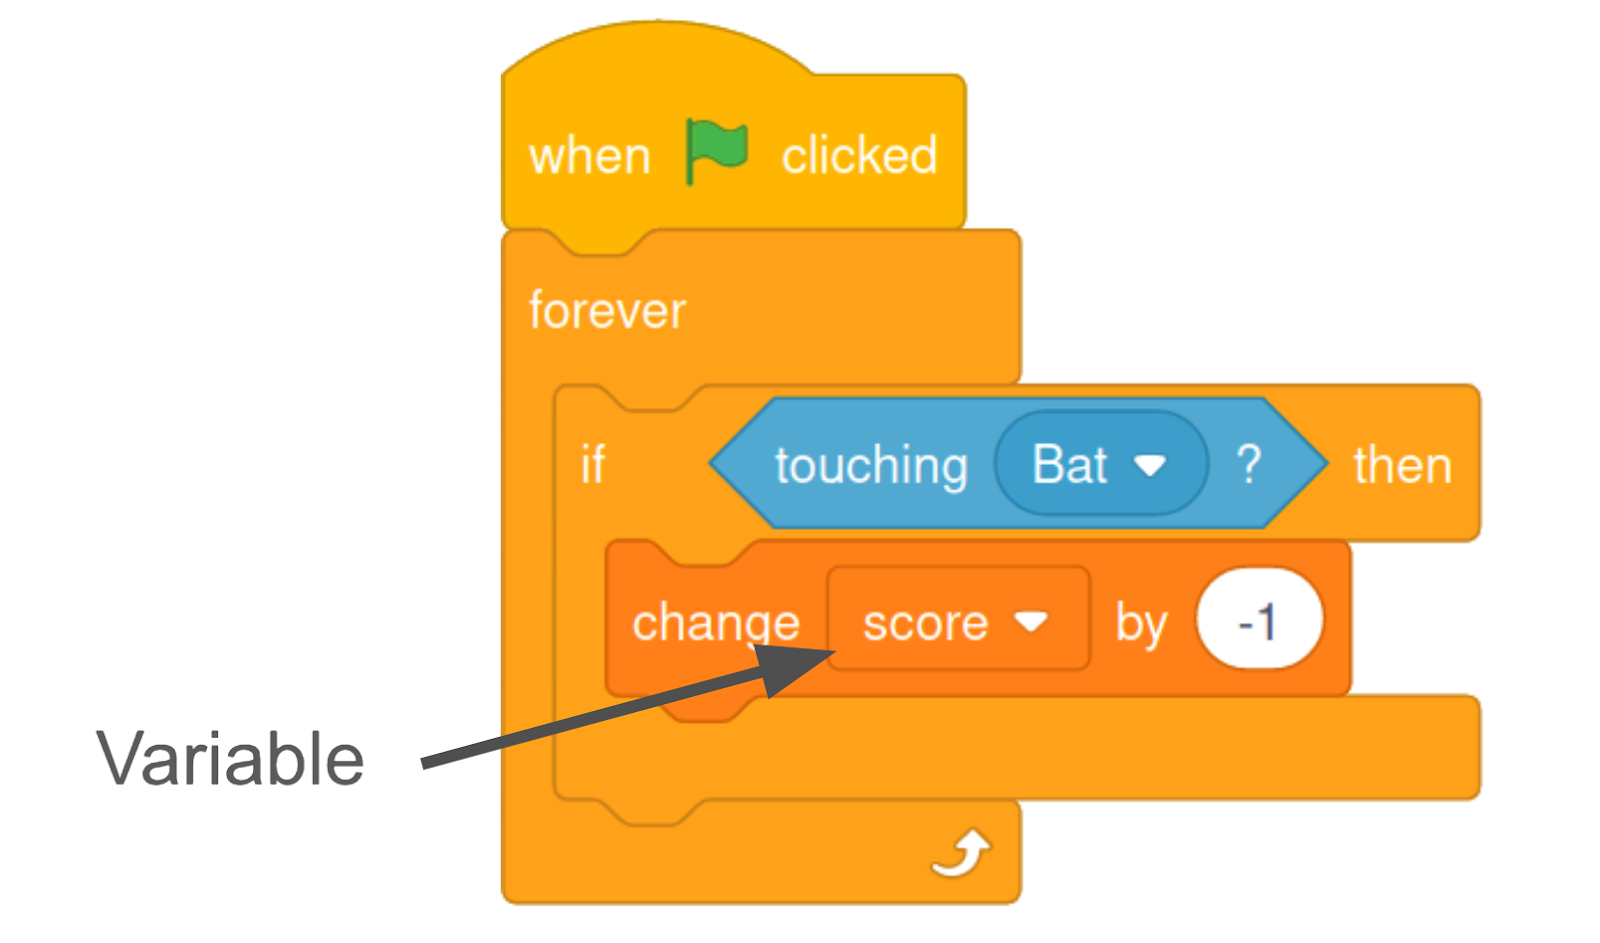
A program made by a stack of Scratch programming blocks. From the top to bottom: ``when clicked,'' ``forever,'' ``if touching Bat? then,'' ``change score by -1.''
A Scratch project code of a score counter in a game. 

As the first step of our study, we collected and qualitatively analyzed 400 discussion threads about variables and lists in the Scratch Q&A forums. Our key finding was that Scratch users use specific, concrete examples to teach each other about variables and lists. These examples are commonly framed in terms of elements in the projects that they are making, often specific to games.

For instance, we observed users teach each other how to make a score counter in a game using variables. In another example, we saw users sharing tips on creating an item inventory in a game using lists. As a result of this focus on specific game elements, user-generated examples and tutorials are often framed in the specifics of these game-making scenarios. For example, a lot of sample Scratch code on variables and lists were from games with popular elements like scores and inventories. While these community-produced learning resources offers valuable concrete examples, not everybody is interested in making games. We some some evidence that users who are not interested in making games involving scores and inventories were less likely to get effective support when they sought to learn about variables. We argue that repeated over time, this dynamic can lead to a social feedback loop where reliance on community-generated resources can place innovative forms of creative coding at a disadvantage compared to historically common forms.
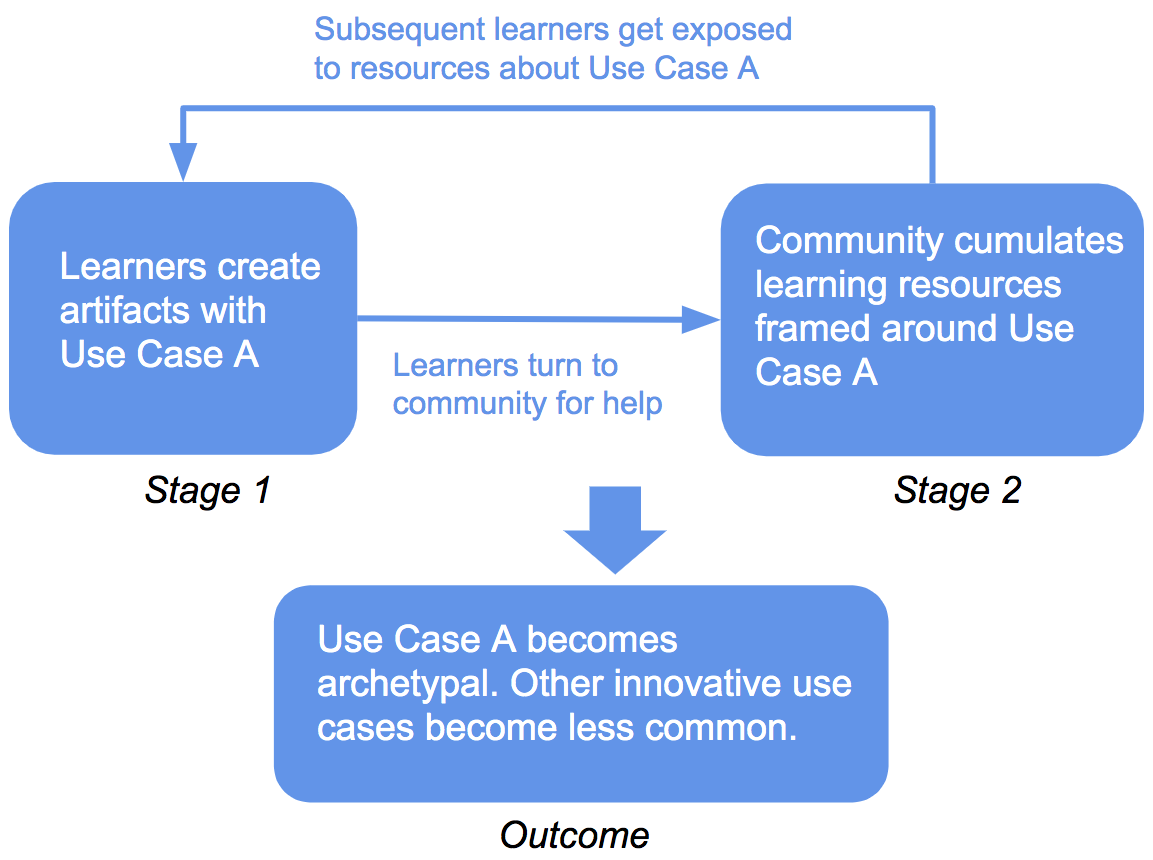
This diagram illustrates the hypothetical social feedback loop that we constructed based on our findings in Study 1. The diagram starts with the box of ``Stage 1'' on the left, and the text that explains Stage 1 says: ``learners create artifacts with Use Case A.'' There is a right-going arrow pointing from Stage 1 to the box of ``Stage 2'' on the right and the text on the arrow says: ``learners turn to the community for help or inspiration.'' The text that explains Study 2 says: ``Community cumulates learning resources framed around Use Case A.'' Above these is a left-going arrow that points from Stage 2 back to Stage 1, forming the loop. The text on the arrow says: ``Subsequent learners get exposed to resources about Use Case A.'' Underneath the entire loop there is an down-going arrow pointing to a box of ``Outcome.'' The text that explains Outcome says: ``Use Case A becomes archetypal. Other innovative use cases become less common.''
Our proposed hypothetical social feedback loop of how community-generated resources may constrain innovative computational participation. 

The graph here is a visualization of the social feedback loop theory that we proposed. Stage 1 suggests that, in an online interest-driven learning community, some specific applications of a concept (“Use Case A”) will be more popular than others. This might be due to random chance or any number of reasons. When seeking community support, learners will tend to ask questions framed specifically around Use Case A and use community resources framed in terms of the same use case. Stage 2 shows the results of this process. As learners receive support, they produce new artifacts with Use Case A that can serve as learning resources for others. Then, learners in the future can use these learning resources, becoming even more likely to create the same specific application. The outcome of the feedback loop is that, as certain applications of a concept become more popular over time, the community’s learning resources are increasingly focused on the same applications.

We tested our social feedback loop theory using 5 years of Scratch data including 241,634 projects created by 75,911 users. We tested both the mechanism and the outcome of the loop from multiple angles in terms of three hypotheses that we believe will be true if our the feedback loop we describe is shaping behavior:

  1. More projects involving variables and lists will be games over time.
  2. The type of project elements that users make with variables and lists (we defined it as the names that they gave to variables and lists) will be more homogenous.
  3. Users who have been exposed to popular variable and list names will be more likely to use those names in their own projects. We found at least some support for all of our hypotheses.

Our results provide broad (if imperfect) support for our social feedback loop theory. For example, the graph below illustrates one of our findings: users who have been exposed to popular list names (solid line) will be more likely to use (in other words, less likely to never use) popular names in their projects, compared to users who have never downloaded projects with popular list names (dashed line). 
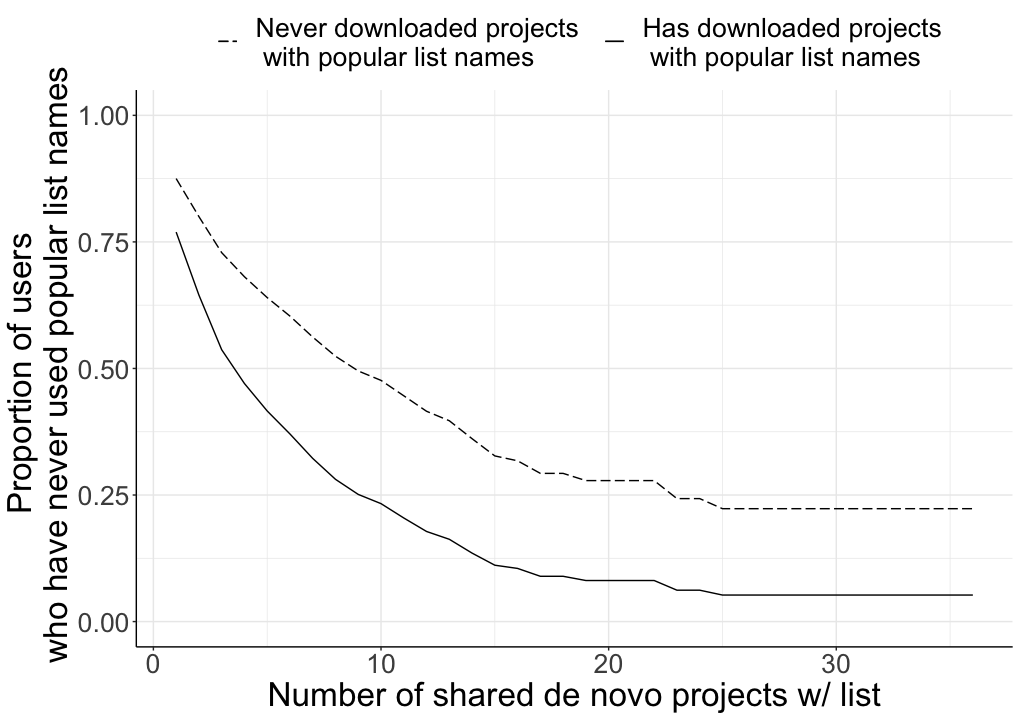
This figure is a line plot that illustrates the curves from the survival analysis for lists. The x-axis is ``Number of shared de novo projects w/ list.'' The labels are ``0'', ``10'', ``20'', and ``30'' from left to right. The y-axis is ``Proportion of users who have never used popular variable names.'' The labels are ``0.00'', ``0.25'', ``0.50'', ``0.75'', and ``1.00'' from bottom to top. There are two lines. The dashed line represents users who never downloaded projects with popular variable names. The solid line represents users who has downloaded projects with popular variable names.The solid line starts at 1 on x-axis and approximately 0.75 on the y-axis. The solid line descends in a convex shape and when it reaches 10 on the x-axis, it is at around 0.25 on the y-axis. The line keeps descending, reaches around 0.05 on the y-axis when it is at 25 on the x-axis, and stays at 0.05 for the rest of the x-axis. The dashed line is significantly higher than the solid line and stays above it the entire graph. The dashed line starts at 1 on x-axis and approximately 0.88 on the y-axis. The dashed line descends in a convex shape that is less steep than the solid line, and when it reaches 10 on the x-axis, it is at around 0.50 on the y-axis. The line keeps descending, reaches around 0.24 on the y-axis when it is at 25 on the x-axis, and stays at 0.24 for the rest of the x-axis.
Plots from our cox proportional survival analysis on the difference between users who have previously downloaded projects with popular list names versus those who have never done so. 

The results from our study describe an important trade-off that designers of online communities in computational learning need to be aware of. On the one hand, learners can learn advanced computational concepts by building their own explanation and understanding on specific use cases that are popular in the community. On the other, such learning can be superficial and not conceptual or generalizable: learners’ preference for peer-generated learning resources around specific interests can restrict the exploration of broader and more innovative uses, which can potentially limit sources of inspiration, pose barriers to broadening participation, and confine learners’ understanding of general concepts. We conclude our paper suggesting several design strategies that might be effective in countering this effect.


Please refer to the preprint of the paper for more details on the study and our design suggestions for future online interest-driven learning communities. We’re excited that this paper has been accepted to CHI 2022 and received the Best Paper Honorable Mention Award! It will be published in the Proceedings of the ACM on Human-Computer Interaction and presented at the conference in May. The full citation for this paper is:

Ruijia Cheng, Sayamindu Dasgupta, and Benjamin Mako Hill. 2022. How Interest-Driven Content Creation Shapes Opportunities for Informal Learning in Scratch: A Case Study on Novices’ Use of Data Structures. In CHI Conference on Human Factors in Computing Systems (CHI ’22), April 29-May 5, 2022, New Orleans, LA, USA. ACM, New York, NY, USA, 16 pages. https://doi.org/10.1145/3491102.3502124

If you have any questions about this research, please feel free to reach out to one of the authors: Ruijia “Regina” Cheng, Sayamindu Dasgupta, and Benjamin Mako Hill.
Fool’s gold? The perils of using online survey samples to study online behavior

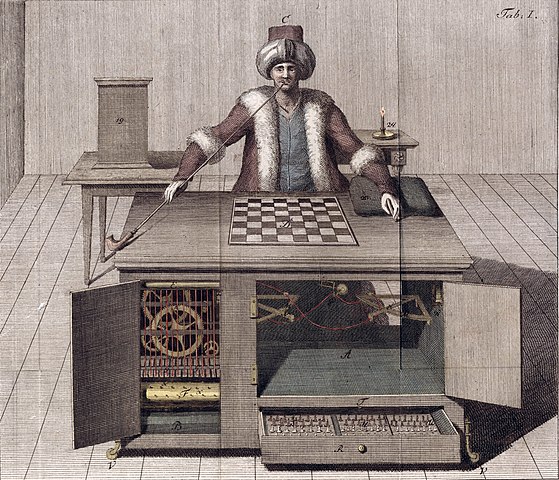
The OG Mechanical Turk (public domain via Wikimedia Commons). It probably was not useful for unbiased survey research sampling either.
When it comes to research about participation in social media, sampling and bias are topics that often get ignored or politely buried in the “limitations” sections of papers. This is even true in survey research using samples recruited through idiosyncratic sites like Amazon’s Mechanical Turk. Together with Eszter Hargittai, I (Aaron) have a new paper (pdf) out in the International Journal of Communication (IJOC) that illustrates why ignoring sampling and bias in online survey research about online participation can be a particularly bad idea.

Surveys remain a workhorse method of social science, policy, and market research. But high-quality survey research that produces generalizable insights into big (e.g., national) populations is expensive, time-consuming, and difficult. Online surveys conducted through sites like Amazon Mechanical Turk (AMT), Qualtrics, and others offer a popular alternative for researchers looking to reduce the costs and increase the speed of their work. Some people even go so far as to claim that AMT has “ushered in a golden age in survey research” (and focus their critical energies on other important issues with AMT, like research ethics!).

Despite the hype, the quality of the online samples recruited through AMT and other sites often remains poorly or incompletely documented. Sampling bias online is especially important for research that studies online behaviors, such as social media use. Even with complex survey weighting schemes and sophisticated techniques like multilevel regression with post-stratification (MRP), surveys gathered online may incorporate subtle sources of bias because the people who complete the surveys online are also more likely to engage in other kinds of activities online.

Surprisingly little research has investigated these concerns directly. Eszter and I do so by using a survey instrument administered concurrently on AMT and a national sample of U.S. adults recruited through NORC at the University of Chicago (note that we published another paper in Socius using parts of the same dataset last year). The results suggest that AMT survey respondents are significantly more likely to use numerous social media, from Twitter to Pinterest and Reddit, as well as have significantly more experiences contributing their own online content, from posting videos to participating in various online forums and signing online petitions.

Such findings may not be shocking, but prevalent research practices often overlook the implications: you cannot rely on a sample recruited from an online platform like AMT to map directly to a general population when it comes to online behaviors. Whether AMT has created a survey research “golden age” or not, analysis conducted on a biased sample produces results that are less valuable than they seem.

The Hidden Costs of Requiring Accounts

Should online communities require people to create accounts before participating?

This question has been a source of disagreement among people who start or manage online communities for decades. Requiring accounts makes some sense since users contributing without accounts are a common source of vandalism, harassment, and low quality content. In theory, creating an account can deter these kinds of attacks while still making it pretty quick and easy for newcomers to join. Also, an account requirement seems unlikely to affect contributors who already have accounts and are typically the source of most valuable contributions. Creating accounts might even help community members build deeper relationships and commitments to the group in ways that lead them to stick around longer and contribute more.

In a new paper published in Communication Research, Benjamin Mako Hill and Aaron Shaw provide an answer. We analyze data from “natural experiments” that occurred when 136 wikis on Fandom.com started requiring user accounts. Although we find strong evidence that the account requirements deterred low quality contributions, this came at a substantial (and usually hidden) cost: a much larger decrease in high quality contributions. Surprisingly, the cost includes “lost” contributions from community members who had accounts already, but whose activity appears to have been catalyzed by the (often low quality) contributions from those without accounts.


The full citation for the paper is: Hill, Benjamin Mako, and Aaron Shaw. 2020. “The Hidden Costs of Requiring Accounts: Quasi-Experimental Evidence from Peer Production.” Communication Research, 48 (6): 771–95. https://doi.org/10.1177/0093650220910345.

If you do not have access to the paywalled journal, please check out this pre-print or get in touch with us. We have also released replication materials for the paper, including all the data and code used to conduct the analysis and compile the paper itself.

Measuring Wikipedia Article Quality in One Continuous Dimension

Accurately estimating the quality of Wikipedia articles is important task for both researchers and Wikipedia community members. In a forthcoming paper in the Proceedings of the OpenSym 2021, I describe a new method for estimating article quality in Wikipedia in one dimension that builds on the widely used ORES quality model and that improves on the techniques researches have used to incorporate measures of quality into their studies of Wikipedia in the past. I will presenting virtually this week at the OpenSym 2021 conference. OpenSym is free and open to the public this year but requires registration.

Numerous efforts have gone into measuring the quality of Wikipedia articles and the Wikimedia Foundation maintains a machine learning model for measuring article quality on English Wikipedia called the ORES quality model. This model is trained on quality assessments conducted by members of WikiProjects that label articles into hierarchy of quality levels (i.e., stub, start-class, C-class, B-class, Good, Featured) and use boosted decision trees to predict the quality of versions of articles. This model is useful because it can predict the quality of versions of articles that haven’t been assessed. My OpenSym paper (teaser video, full presentation) builds on the ORES quality models to improve measuring Wikipedia article quality in one continuous dimension using ordinal regression models. A 1-D real-valued measure of quality is more granular and easier to use in downstream research. My method also increases the accuracy of quality prediction for units of analysis that are most important for research like articles or revisions and also estimates spacing between different levels of article quality.

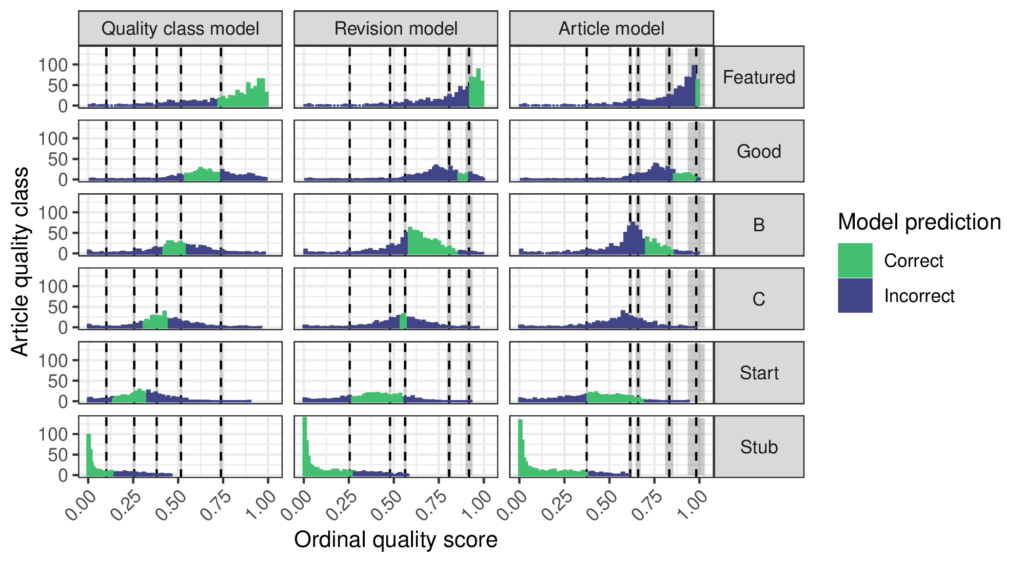
Quality scores and predictions of the ordinal regression models. Columns in the grid of charts correspond to the ordinal quality model calibrated to the indicated unit of analysis and rows correspond to sampled articles having the indicated level of quality as assessed by Wikipedians. Each chart shows the histogram of scores, thresholds inferred by the ordinal model with 95% credible intervals colored in gray, and colors indicating when the model makes correct or incorrect predictions. The thresholds are not evenly spaced, especially in revision model and article model that have more weight on lower quality classes. These two models infer that the gaps between Stub and Start and between Start and C-class articles are considerably wider than the gap between C-class and B-class articles.

An important limitation of the ORES quality models is that they do not output a single real-valued quality score. Instead, they output a multinomial distribution of the probability of an article’s quality class. This means that instead of saying “article X has quality 0.3” the model tells you “the probability of article X’s quality class is 0.1 for stub, 0.2 for start-class, 0.5 for C-class, 0.15 for B-class, 0.05 for Good and 0 for featured and the most probable quality class (MPQC) is C.” Using this kind of output in a downstream statistical analysis is kind of messy. For example, it might seem reasonable to use the MPQC as an integer-valued measure of quality, but this throws away information. Suppose ORES says that “the probability of article Y’s quality class is 0.00 for stub, 0.15 for start-class, 0.5 for C-class, 0.2 for B-class, 0.1 for Good, and 0.05 for Featured” According to the ORES quality model, Y probably has greater quality than X. Even though both have a MPQC of C-class, there’s a much greater change for article Y to be B-class or better than for article X. Is there a way to use the ORES probabilities to build a more granular measure of quality that accounts for this difference?

Aaron Halfaker, one of the creators of the ORES system, combined the probabilities into a 1-D score for one of his research projects by taking a weighed sum of the probabilities and assuming that Wikipedia article quality levels are “evenly spaced.” This creates a score out of the quality class probabilities by multiplying each probability by a weight so that probabilities for higher quality levels get more weight. He chose the weights [0,1,2,3,4,5] so an article gets 0 quality points for being a probable stub, 1 for the probability of being start-class, 2 for C-class, and so on with 5 points for Featured. This results in a nice continuous measure of quality that simplifies downstream statistical analysis. A number of others have followed his lead.

But how reasonable is the “evenly spaced” assumption that supports using the weights [0,1,2,3,4,5]? Could there be a way to pick weights to combine the ORES probabilities without using this assumption? My paper explains why ordinal regression is the right tool for the job and proposes a procedure for fitting an ordinal regression model to a sample representative of a unit of analysis like articles or revisions or quality classes that have been labeled by a WikiProject and scored by the ORES quality model. The ordinal regression predicts the quality labels as a function of the ORES scores and in this way finds a good way to combine the ORES scores into a single value. It also infers threshold parameters that define different regions of the quality score corresponding to quality classes and this allows the “evenly spaced” assumption to be tested. The figure above shows that the article quality levels are not evenly spaced! Interestingly, the way that they are unevenly spaced depends on how quality is measured. If the quality scale is designed to be accurate across all quality classes, then the quality levels are relatively even. However, if it is designed to be accurate for revisions or articles then more of the scale goes to lower levels of quality. Overall, the models agree that the difference between C-class and Start articles is smaller than that between the other levels.

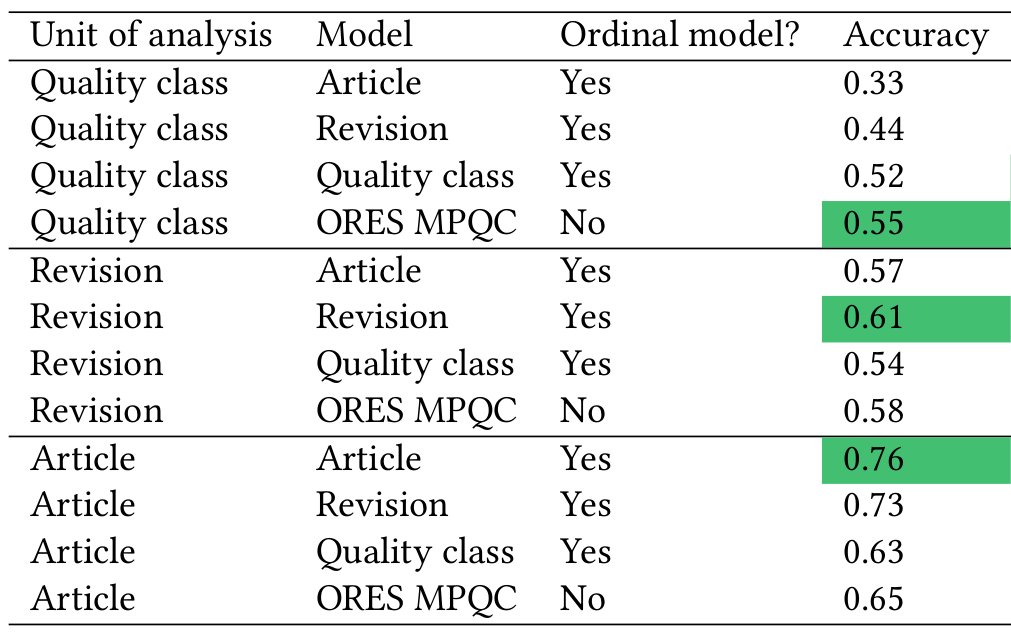
Using the quality scores based on ordinal regression also improves accuracy. This mostly comes from calibrating the ordinal model to the appropriate unit of analysis. The ORES quality model is fit on a “balanced” dataset where each quality class is equally represented. This means that the ORES quality model has learned that each quality class is equally likely to occur in the data. Of course, in reality lower quality articles are far more common than high quality articles. There are over 3,000,000 Stubs on English Wikipedia but less than 8,000 Featured articles. As the table below shows, fitting ordinal models that know the true proportion of each quality class in a sample can improve accuracy compared to the ORES quality model.

Accuracy of quality prediction models depends on the unit of analysis. The greatest accuracy scores are highlighted. Models are more accurate when calibrated on the same unit of analysis on which they are evaluated. Compared to the MPQC, the ordinal quality models have better accuracy when revisions or articles are the unit of analysis. When the quality class is the unit of analysis, the ordinal quality model has slightly worse accuracy.

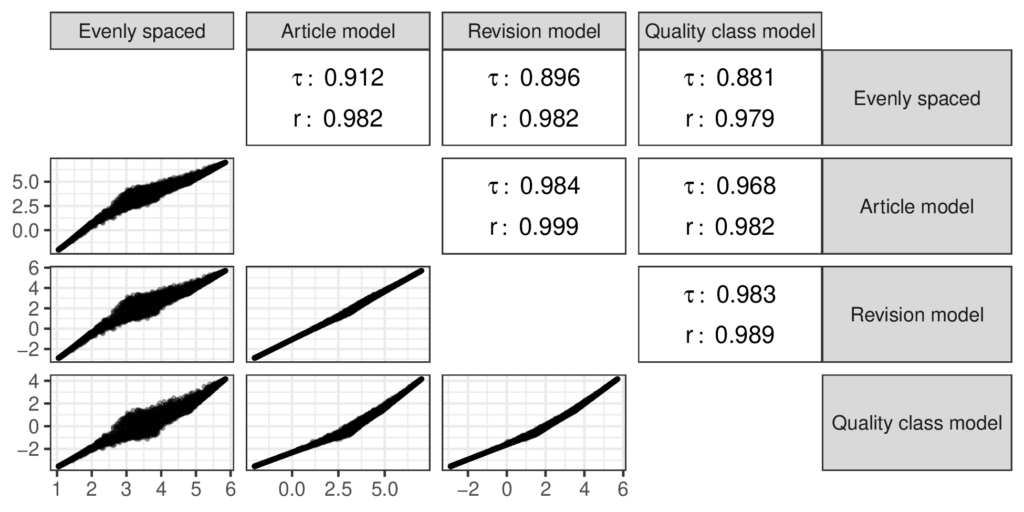
Even though my study has found evidence against the “evenly spaced” assumption, I also found that the quality scores based on it are strongly correlated with the scores from the ordinal model as shown in the figure below. The ‘𝜏’ symbols in the figure stand for the Kendall rank correlation coefficient while the ‘r’ symbols stand for the Pearson correlation coefficient. I used the Kendall correlation because it can capture nonlinear divergences between the measures and the Pearson coefficient is the familiar linear correlation. The “evenly spaced” scores aren’t totally in agreement with the scores from the ordinal models, but they are close enough that I doubt that prior research that used the “evenly spaced” scores to measure quality was mislead by this choice.

Correlations between quality measures show that the different approaches to measuring quality are quite similar. “Evenly spaced” uses the weighted sum of the ORES scores with handpicked coefficients [0,1,2,3,4,5]. Lower values of Kendall’s 𝜏, a nonparametric rank correlation statistic, compared to Pearson’s 𝑟 suggest nonlinear differences between the weighted sum and the other measures.

Conclusions

Measuring article quality in one continuous dimension is a valuable tool for studying the peer production of information goods because it provides granularity and is amenable to statistical analysis. Prior approaches extended ORES article quality prediction into a continuous measure under the “evenly spaced” assumption. I used ordinal regression models to transform the ORES predictions into a continuous measure of quality that is interpretable as a probability distribution over article quality levels, provides an account of its own uncertainty and does not assume that quality levels are “evenly spaced.” Calibrating the models to the chosen unit of analysis improves accuracy for research applications. I recommend that future work adopt this approach when article quality is an independent variable in a statistical analysis.

My paper also has a number of other tidbits about the uncertainty of different quality measures, the importance of feedback between measurement and knowledge in the scientific process and demonstrates model calibration.


A preprint of the paper is available here. The paper has been accepted to OpenSym 2021 and will be presented at the virtual conference on September 17th. A video of the presentation is available here. A dataverse repository containing code and data from the project is available here.

Why do people participate in small online communities?

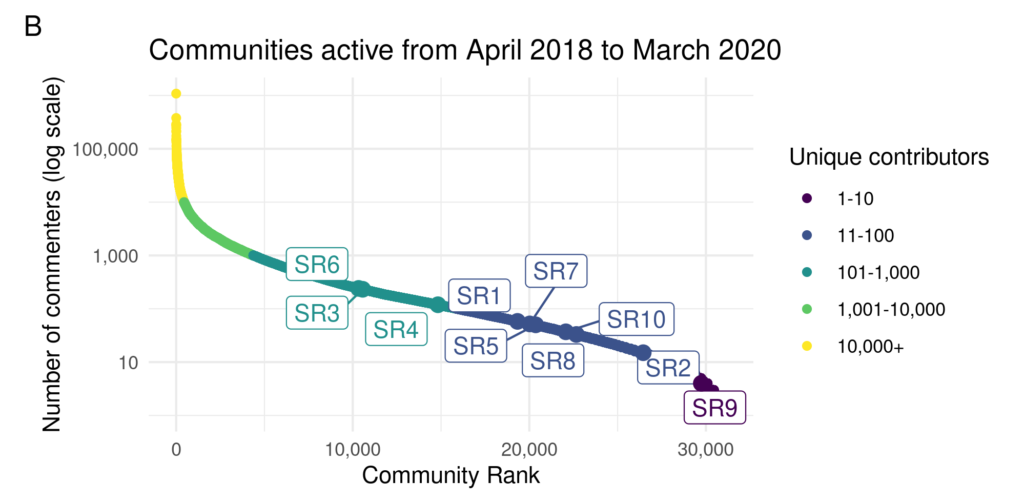
The number of unique commenters who commented on subreddits in March 2020, for subreddits that had at least 1 comment in the each of the previous 23 months. The “SR” communities are those we drew our interview sample from.

When it comes to online communities, we often assume that bigger is better. Large communities can create robust interactions, have access to broad and extensive body of experiences, and provide many opportunities for connections. As a result, small communities are often thought as failed attempts to build big ones. In reality, most online communities are very small and most small communities remain small throughout their lives.  If growth and a large number of members are so advantageous, why do small communities not only exist but persist in their smallness?

In a recent research study, we investigated why individuals participate in these persistently small online communities by interviewing twenty participants of small subreddits  on Reddit. We asked people about their motivations and explicitly tried to get them to compare their experiences in small subreddits with their experience in larger subreddits. Below we present three of the main things that we discovered through analyzing our conversations.

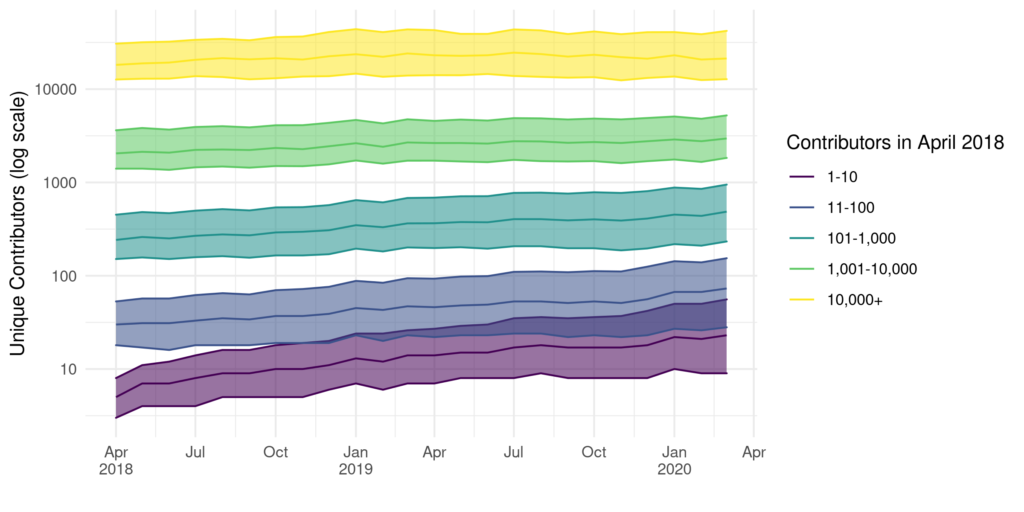
Size of consistently active subreddits over time (i.e., those with at least one comment per month from April 2018 to March 2020). Subreddits are grouped by their size in April 2018. Lines represent the median size each month, and ribbons show the first and third quartiles.

Informational niches

First, we found that participants saw their small communities as unique spaces for information and interaction. Frequently, small communities are narrower versions or direct offshoots of larger communities. For example, the r/python community is about the programming language Python while the r/learnpython community is a smaller community explicitly for newcomers to the language. 

By being in a smaller, more specific community, our participants described being able to better anticipate the content, audience, and norms: a specific type of content, people who cared about the narrow topic just like them, and expectations of how to behave online. For example, one participant said:

[…] I can probably make a safe assumption that people there more often than not know what they’re talking about. I’ll definitely be much more specific and not try to water questions down with like, my broader scheme of things—I can get as technical as possible, right? If I were to ask like the same question over at [the larger parent community], I might want to give a little bit background on what I’m trying to do, why I’m trying to do it, you know, other things that I’m using, but [in small community], I can just be like, hey, look, I’m trying to use this algorithm for this one thing. Why should I? Or should I not do it for this?

Curating online experiences

More broadly, participants explained their participation in these small communities as part of an ongoing strategy of curating their online experience. Participants described a complex ecosystem of interrelated communities that the small communities sat within, and how the small communities gave them the ability to select very specific topics, decide who to interact with, and manage content consumption.

In this sense, small communities give individuals a semblance of control on the internet. Given the scale of the internet—and a widespread sense of malaise with online hate, toxicity, and harassment—it is possible that controlling the online experience is more important to users than ever. Because of their small size, these small communities were largely free of the vandals and trolls that plague large online communities, and  several participants described their online communities as special spaces to get away from the negativity on the rest of the internet. 

Relationships

Finally, one surprise from our research was what we didn’t find. Previous research led us to predict that people would participate in small communities because they would make it easier to develop friendships with other people. Our participants described being interested in the personal experiences of other group members, but not in building individual relationships with them.

Conclusions

Our research shows that small online communities play an important and underappreciated role. At the individual level, online communities help people to have control over their experiences, curating a set of content and users that is predictable and navigable. At the platform level, small communities seem to have a symbiotic relationship with large communities. By breaking up broader topical niches, small communities likely help to keep a larger set of users engaged.

We hope that this paper will encourage others to take seriously the role of small online communities. They are qualitatively different from large communities, and more empirical and theoretical research is needed in order to understand how communities of different sizes operate and interact in community ecosystems.


A preprint of the paper is available here. We’re excited that this paper has been accepted to CSCW2021 and will be published in the Proceedings of the ACM on Human-Computer Interaction and presented at the conference in November. If you have any questions about this research, please feel free to reach out to one of the authors: Sohyeon Hwang or Jeremy Foote.

Do generous attitudes underlie contributions to user-generated content?

User-generated content on the Internet provides the basis for some of the most popular websites, such as Wikipedia, crowdsourced question-and-answer sites like Stack Overflow, video-sharing sites like YouTube, and social media platforms like Reddit. Much (or in some cases all) of the content on these sites is created by unpaid volunteers, who invest substantial time and effort to produce high quality information resources. So are these volunteers and content contributors more generous in general than people who don’t contribute their time, knowledge, or information online?

We (Floor Fiers, Aaron Shaw, and Eszter Hargittai) consider this question in a recent paper published in The Journal of Quantitative Description: Digital Media (JQD:DM). The publication of this particularly is exciting because it pursues a new angle on these questions, and also because it’s part of the inaugural issue of JQD:DM, a new open-access venue for research that seeks to advance descriptive (as opposed to analytic or causal) knowledge about digital media.

The study uses data from a national survey of U.S. adult internet users that includes questions about many kinds of online contribution activities, various demographic and background attributes, as well as a dictator game to measure generosity. In the dictator game, each participant has an opportunity to make an anonymous donation of some unanticipated funds to another participant in the study. Prior experimental research across the social sciences has used dictator games, but no studies we know of had compared dictator game donations with online content contributions.

Sharing content. GotCredit via flickr.

Overall, we find that people who contribute some kind of content online exhibit more generosity in the dictator game. More specifically, we find that people producing any type of user-generated content tend to donate more in the dictator game than those who do not produce any such content. We also disaggregate the analysis by type of content contribution and find that donating in the dictator game only correlates with content contribution for those who write reviews, upload public videos, pose or answer questions, and contribute to encyclopedic knowledge collections.

So, generous attitudes and behaviors may help explain contributions to some types of user-generated content, but not others. This implies that user-generated content is not a homogeneous activity, since variations exist between different types of content contribution.

The (open access!) paper has many more details, so we hope you’ll download, read, and cite it. Please feel free to leave a comment below too.

Paper Citation: Fiers, Floor, Aaron Shaw, and Eszter Hargittai. 2021. “Generous Attitudes and Online Participation”. Journal of Quantitative Description: Digital Media 1 (April). https://doi.org/10.51685/jqd.2021.008.

Detecting At-Risk Software Infrastructure

A span of cracked concrete with exposed rebar.
Crumbling infrastructure. J.C. Burns (jcburns) via flickr, CC BY-NC-ND 2.0

Critical software we all rely on can silently crumble away beneath us. Unfortunately, we often don’t find out software infrastructure is in poor condition until it is too late. Over the last year or so, I have been leading a project I announced earlier to measure software underproduction—a term I use to describe software that is low in quality but high in importance.

Underproduction reflects an important type of risk in widely used free/libre open source software (FLOSS) because participants often choose their own projects and tasks. Because FLOSS contributors work as volunteers and choose what they work on, important projects aren’t always the ones to which FLOSS developers devote the most attention. Even when developers want to work on important projects, relative neglect among important projects is often difficult for FLOSS contributors to see.

Given all this, what can we do to detect problems in FLOSS infrastructure before major failures occur? I recently published and presented a paper laying out our new method for measuring underproduction at the IEEE International Conference on Software Analysis, Evolution and Reengineering (SANER) 2021 that I believe provides one important answer to this question.

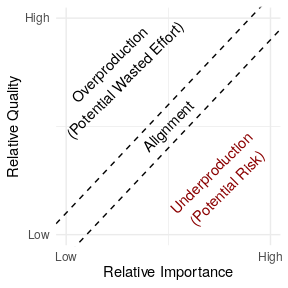
A conceptual diagram of underproduction. The x-axis shows relative importance, the y-axis relative quality. The top left area of the graph described by these axes is 'overproduction' -- high quality, low importance. The diagonal is Alignment: quality and importance are approximately the same. The lower right depicts underproduction -- high importance, low quality -- the area of potential risk.
Conceptual diagram showing how our conception of underproduction relates to quality and importance of software.

In the paper—coauthored with Benjamin Mako Hill—we describe a general approach for detecting “underproduced” software infrastructure that consists of five steps: (1) identifying a body of digital infrastructure (like a code repository); (2) identifying a measure of quality (like the time to takes to fix bugs); (3) identifying a measure of importance (like install base); (4) specifying a hypothesized relationship linking quality and importance if quality and importance are in perfect alignment; and (5) quantifying deviation from this theoretical baseline to find relative underproduction.

To show how our method works in practice, we applied the technique to an important collection of FLOSS infrastructure: 21,902 packages in the Debian GNU/Linux distribution. Although there are many ways to measure quality, we used a measure of how quickly Debian maintainers have historically dealt with 461,656 bugs that have been filed over the last three decades. To measure importance, we used data from Debian’s Popularity Contest opt-in survey. After some statistical machinations that are documented in our paper, the result was an estimate of relative underproduction for the 21,902 packages in Debian we looked at.


One of our key findings is that underproduction is very common in Debian. By our estimates, at least 4,327 packages in Debian are underproduced. As you can see in the list of the “most underproduced” packages—again, as estimated using just one more measure—many of the most at risk packages are associated with the desktop and windowing environments where there are many users but also many extremely tricky integration-related bugs.

This table shows the 30 packages with the most severe underproduction problem in Debian, shown as a series of boxplots.
These 30 packages have the highest level of underproduction in Debian according to our analysis.

We hope these results are useful to folks at Debian and the Debian QA team. We also hope that the basic method we’ve laid out is something that others will build off in other contexts and apply to other software repositories.

In addition to the paper itself and the video of the conference presentation on Youtube, we’ve put a repository with all our code and data in an archival repository Harvard Dataverse and we’d love to work with others interested in applying our approach in other software ecosytems.


For more details, check out the full paper which is available as a freely accessible preprint.

This project was supported by the Ford/Sloan Digital Infrastructure Initiative. Wm Salt Hale of the Community Data Science Collective and Debian Developers Paul Wise and Don Armstrong provided valuable assistance in accessing and interpreting Debian bug data. René Just generously provided insight and feedback on the manuscript.

Paper Citation: Kaylea Champion and Benjamin Mako Hill. 2021. “Underproduction: An Approach for Measuring Risk in Open Source Software.” In Proceedings of the IEEE International Conference on Software Analysis, Evolution and Reengineering (SANER 2021). IEEE.

Contact Kaylea Champion (kaylea@uw.edu) with any questions or if you are interested in following up.

Update on the COVID-19 Digital Observatory

A few months ago we announced the launch of a COVID-19 Digital Observatory in collaboration with Pushshift and with funding from Protocol Labs. As part of this effort over the last several months, we have aggregated and published public data from multiple online communities and platforms. We’ve also been hard at work adding a series of new data sources that we plan to release in the near future.

Transmission electron microscope image of SARS-CoV-2—also known as 2019-nCoV, the not-so-novel-anymore virus that causes COVID-19 (Source: NIH NIAID via Wikimedia Commons, cc-sa 2.0)

More specifically, we have been gathering Search Engine Response Page (SERP) data on a range of COVID-19 related terms on a daily basis. This SERP data is drawn from both Bing and Google and has grown to encompass nearly 300GB of compressed data from four months of daily search engine results, with both PC and mobile results from nearly 500 different queries each day.

We have also continued to gather and publish revision and pageview data for COVID-related pages on English Wikipedia which now includes approximately 22GB of highly compressed data (several dozen gigabytes of compressed revision data each day) from nearly 1,800 different articles—a list that has been growing over time.

In addition, we are preparing releases of COVID-related data from Reddit and Twitter. We are almost done with two datasets from Reddit: a first one that includes all posts and comments from COVID-related subreddits, and a second that includes all posts or comments which include any of a set of COVID-related terms.

For the Twitter data, we are working out details of what exactly we will be able to release, but we anticipate including Tweet IDs and metadata for tweets that include COVID-related terms as well as those associated with hashtags and terms we’ve identified in some of the other data collection. We’re also designing a set of random samples of COVID-related Twitter content that will be useful for a range of projects.

In conjunction with these dataset releases, we have published all of the code to create the datasets as well as a few example scripts to help people learn how to load and access the data we’ve collected. We aim to extend these example analysis scripts in the future as more of the data comes online.

We hope you will take a look at the material we have been releasing and find ways to use it, extend it, or suggest improvements! We are always looking for feedback, input, and help. If you have a COVID-related dataset that you’d like us to publish, or if you would like to write code or documentation, please get in touch!

All of the data, code, and other resources are linked from the project homepage. To receive further updates on the digital observatory, you can also subscribe to our low traffic announcement mailing list.

Are Vandals Rational?

Although Wikipedia is the encyclopedia that anybody can edit, not all edits are welcome. Wikipedia is subject to a constant deluge of vandalism. Random people on the Internet are constantly “blanking” Wikipedia articles by deleting their content, replacing the text of articles with random characters, inserting outlandish claims or insults, and so on. Although volunteer editors and bots do an excellent job of quickly reverting the damage, the cost in terms of volunteer time is real.

Why do people spend their time and energy vandalizing web pages? For readers of Wikipedia that encounter a page that has been marred or replaced with nonsense or a slur—and especially for all the Wikipedia contributors who spend their time fighting back the tide of vandalism by checking and reverting bad edits and maintaining the bots and systems that keep order—it’s easy to dismiss vandals as incomprehensible sociopaths.

In a paper I just published in the ACM International Conference on Social Media and Society, I systematically analyzed a dataset of Wikipedia vandalism in an effort to identify different types of Wikipedia vandalism and to explain how each can been seen as “rational” from the point of view of the vandal.

You can see Kaylea present this work via a 5-minute YouTube talk.

Leveraging a dataset we created in some of our other work, the study used a random sample of contributions drawn from four groups that vary in the degree to the editors in question can be identified by others in Wikipedia: established users with accounts, users with accounts making their first edits, users without accounts, and users of the Tor privacy tool. Tor users were of particular interest to me because the use of Tor offers concrete evidence that a contributor is deliberately seeking privacy. I compared the frequency of vandalism in each group, developed an ontology to categorize it, and tested the relationship between group membership and different types of vandalism.

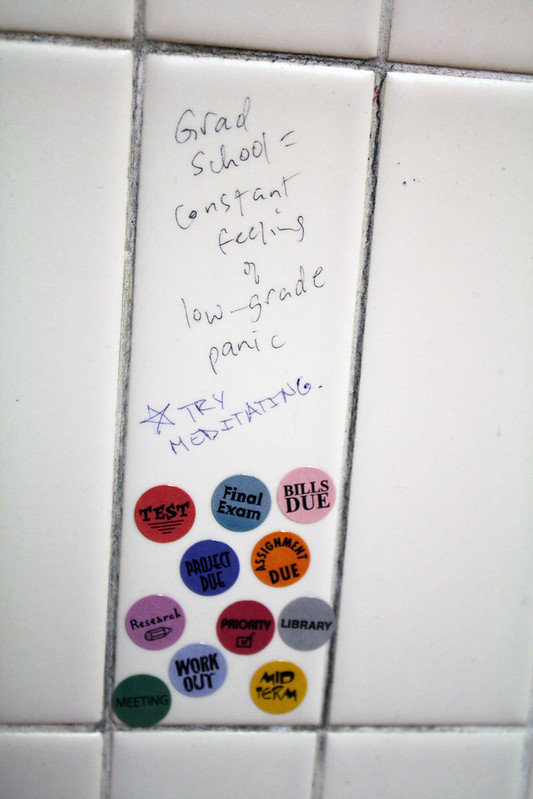
Vandalism in an University bathroom. [“Whiteboard Revisited.” Quinn Dombrowski. via flickr, CC BY-SA 2.0]

I found that the group that had engaged in the least effort in order to edit—users without accounts—were the most likely to vandalize. Although privacy-seeking Tor contributors were not the most likely to vandalize, vandalism from Tor-based contributors was less likely to be sociable, was more likely to be large scale (i.e. large blocks of text, such as by pasting in the same lines over and over), and more likely to express frustration with the Wikipedia community.

Thinking systematically about why different groups of users might engage in vandalism can help counter vandalism. Potential interventions might change not just the amount, but also the type, of vandalism a community will receive. Tools to detect vandalism may find that the patterns in each category allow for more accurate targeting. Ultimately, viewing vandals as more than irrational sociopaths opens potential avenues for dialogue.


For more details, check out the full paper which is available as a freely accessible preprint. The project would not have been possible without Chau Tran’s work to develop a dataset of contributions from Tor users. This work was supported by the National Science Foundation (Awards CNS-1703736 and CNS-1703049).

Paper Citation: Kaylea Champion. 2020. “Characterizing Online Vandalism: A Rational Choice Perspective.” In International Conference on Social Media and Society (SMSociety’20). Association for Computing Machinery, New York, NY, USA, 47–57. https://doi.org/10.1145/3400806.3400813

Tor users: An untapped resource for Wikipedia?

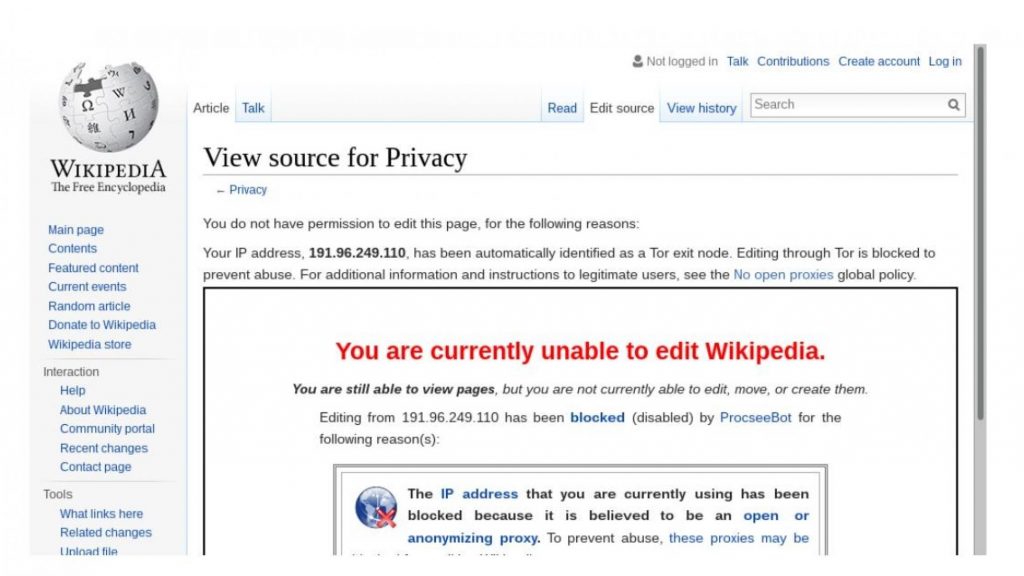
screenshot of Wikipedia banning tor users
An image displaying the message that Tor users typically receive when trying to make edits on Wikipedia, stating that the user’s IP address has been identified as a Tor exit node, and that “editing through Tor is blocked to prevent abuse.”

Like everyone else, Internet users who protect their privacy by using the anonymous browsing software Tor are welcome to read Wikipedia. However, when Tor users try to contribute to the self-described “encyclopedia that anybody can edit,” they typically come face-to-face with a notice explaining that their participation is not welcome.

Our new paper—led by Chau Tran at NYU and authored by a group of researchers from the University of Washington, the Community Data Science Collective, Drexel, and New York University—was published and presented this week at the IEEE Symposium on Security & Privacy and provides insight into what Wikipedia might be missing out on by blocking Tor. By comparing contributions from Tor that slip past Wikipedia’s ban to edits made by other types of contributors, we find that Tor users make contributions to Wikipedia that are just as valuable as those made by new and unregistered Wikipedia editors. We also found that Tor users are more likely to engage with certain controversial topics.

One-minute “Trailer” for our paper and talk at the IEEE Symposium on Security & Privacy. Video was produced by Tommy Ferguson at the UW Department of Communication.

To conduct our study, we first identified more than 11,000 Wikipedia edits made by Tor users who were able to bypass Wikipedia’s ban on contributions from Tor between 2007 and 2018. We then used a series of quantitative techniques to evaluate the quality of these contributions. We found that Tor users made contributions that were similar in quality to, and in some senses even better than, contributions made by other users without accounts and newcomers making their first edits.

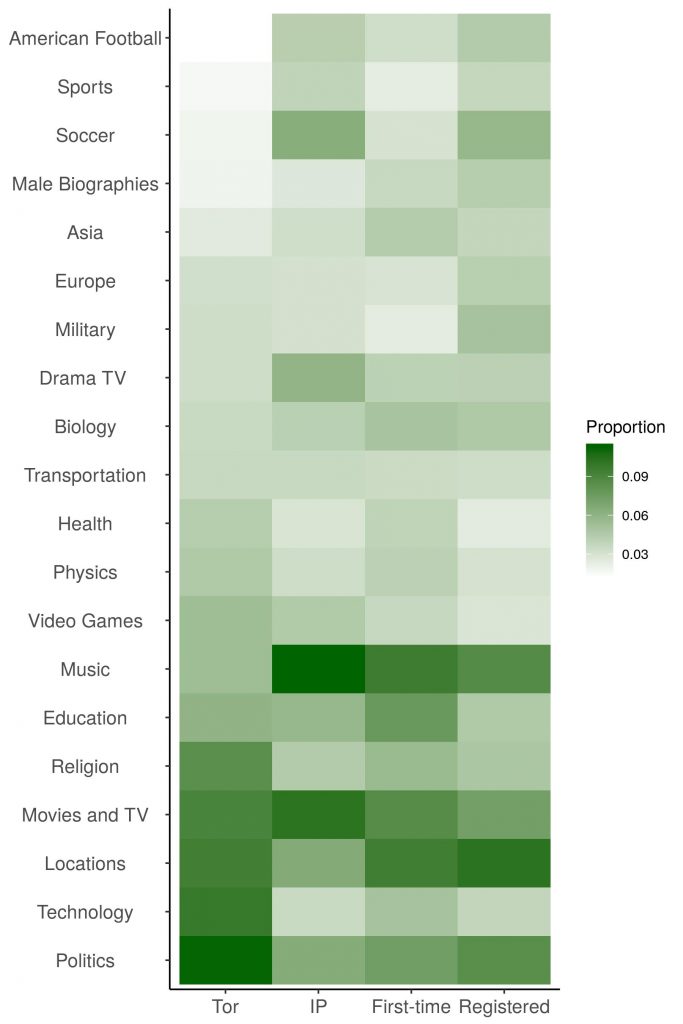
An image from the study showing the differences in topics edited by Tor users and other Wikipedia users. The image suggests that Tor users are more likely to edit pages discussing topics such as politics, religion, and technology. Other types of users, including IP, First-time, and Registered editors, are more likely to edit pages discussing topics such as music and sports.

We used a range of analytical techniques including direct parsing of article histories, manual inspections of article changes, and a machine learning platform called ORES to analyze contributions. We also used a machine learning technique called topic modeling to analyze Tor users’ areas of interest by checking their edits against clusters of keywords. We found that Tor-based editors are more likely than other users to focus on topics that may be considered controversial, such as politics, technology, and religion.

In a closely connected study led by Kaylea Champion and published several months ago in the Proceedings of the ACM on Human Computer Interaction (CSCW), we conducted a forensic qualitative analysis of contributions of the same dataset. Our results in that study are described in a separate blog post about that project and paint a complementary picture of Tor users engaged—in large part—in uncontroversial and quotidian types of editing behavior.

Across the two papers, our results are similar to other work that suggests that Tor users are very similar to other internet users. For example, one previous study has shown that Tor users frequently visit websites in the Alexa top one million.

Much of the discourse about anonymity online tends toward extreme claims backed up by very little in the way of empirical evidence or systematic study. Our work is a step toward remedying this gap and has implications for many websites that limit participation by users of anonymous browsing software like Tor. In the future, we hope to conduct similar systematic studies in contexts beyond Wikipedia.

Video of the conference presentation at the IEEE Symposium on Security & Privacy 2020 by Chau Tran.

In terms of Wikipedia’s own policy decisions about anonymous participation, we believe that our paper suggests that the benefits of a “pathway to legitimacy” for Tor contributors to Wikipedia might exceed the potential harm due to the value of their contributions. We are particularly excited about exploring ways to allow contributors from anonymity-seeking users under certain conditions: for example, requiring review prior to changes going live. Of course, these are questions for the Wikipedia community to decide but it’s a conversation that we hope our research can inform and that we look forward to participating in.


Authors of the paper, “Are anonymity-seekers just like everybody else? An analysis of contributions to Wikipedia from Tor,” include Chau Tran (NYU), Kaylea Champion (UW & CDSC), Andrea Forte (Drexel), Benjamin Mako Hill (UW & CDSC), and Rachel Greenstadt (NYU). The paper was published at the 2020 IEEE Symposium on Security & Privacy between May 18 and 20. Originally to be held in San Francisco, the event was held digitally due to the COVID-19 pandemic. This blog post borrows with permission from this news release by Andrew Laurent at NYU.

Paper Citation: Tran, Chau, Kaylea Champion, Andrea Forte, Benjamin Mako Hill, and Rachel Greenstadt. “Are Anonymity-Seekers Just like Everybody Else? An Analysis of Contributions to Wikipedia from Tor.” In 2020 IEEE Symposium on Security and Privacy (SP), 1:974–90. San Francisco, California: IEEE Computer Society, 2020. https://doi.org/10.1109/SP40000.2020.00053.

The research was funded by the National Science Foundation.