Forming: Group members get to know each other and define their task.
Storming: Through argument and disagreement, power dynamics emerge and are negotiated.
Norming: After conflict, groups seek to avoid conflict and focus on cooperation and setting norms for acceptable behavior.
Performing: There is both cooperation and productive dissent as the team performs the task at a high level.
Fortunately for organizational science, 1965 was hardly the last stage of development for Tuckman’s theory!
Twelve years later, Tuckman suggested that adjourning or mourning reflected potential fifth stages (Tuckman and Jensen 1977). Since then, other organizational researchers have suggested other stages including transforming and reforming (White 2009), re-norming (Biggs), and outperforming (Rickards and Moger 2002).
What does the future hold for this line of research?
The good news is that despite the active stream of research producing new stages that end or rhyme with -orming, there are tons of great words left!
For example, stages in a group’s development might include:
Scorning: In this stage, group members begin mocking each other!
Misinforming: Groups that reach this stage start producing fake news.
Shoehorning: These groups try to make their products fit into ridiculous constraints.
Chloroforming: Groups become languid and fatigued?
One benefit of keeping our list in the wiki is that the organizational research community can use it to coordinate! If you are planning to use one of these terms—or if you know of a paper that has—feel free to edit the page in our wiki to “claim” it!
For the second year, Matt Salganik and Chris Bail are running a two-week Summer Institute in Computational Social Science at Duke Univeristy. The goal of the institute is to bring social scientists and data scientists together to learn about computational social science, which can be described as a merger of their two fields.
This year, there are seven partner locations where local students livestream the activities from Duke and learn from local computational social scientists. Both of our universities are among the partner locations.
At the University of Washington, Kaylea and Charlie have both been accepted as participants in the UW summer institute. At Northwestern University, Jeremy is helping to organize SICSS Chicago.
Much of the work that we do in the Community Data Science Collective could be considered computational social science, and we are excited about the potential for computational methods in social science. This is a great program for helping to disseminate computational social science approaches and train the next generation of computational social scientists. The Community Data Science Collective is happy to be a sponsor of the Chicago partner location.
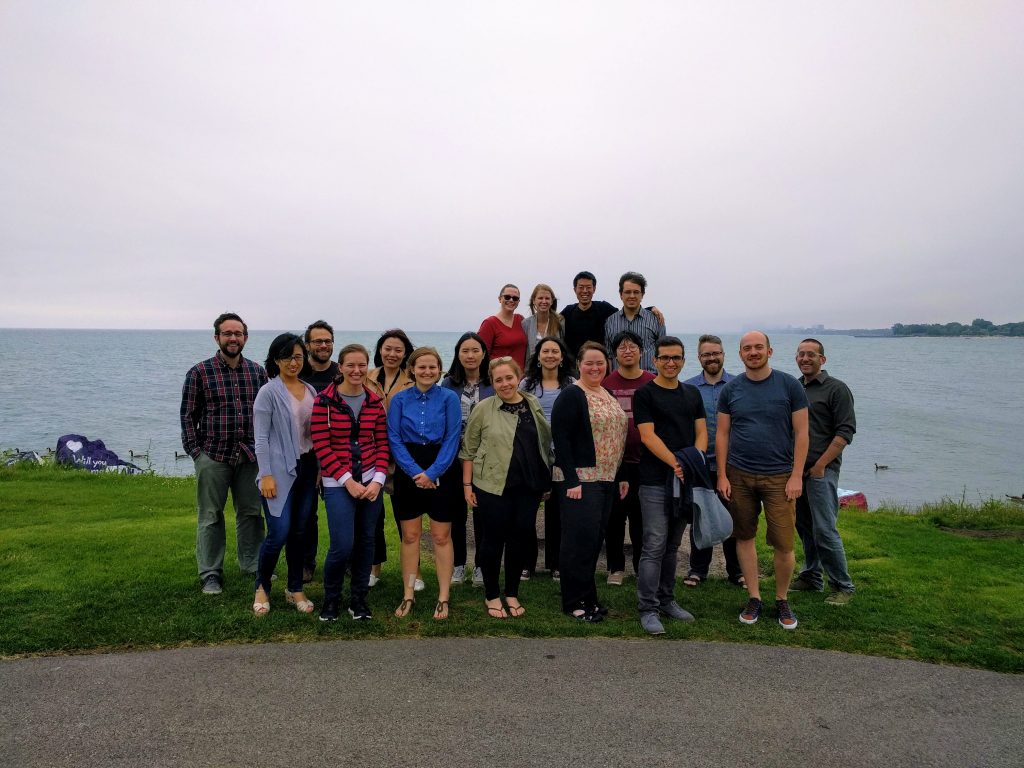
Photo of the SICSS participants in Chicago, sponsored by CDSC!
UNC has has every reason to be excited. Sayamindu has been making our research collective look good for several years. Much of this is obvious in the pile of papers and awards he’ s built. In less visible roles, Sayamindu has helped us build infrastructure, mentored graduate and undergraduate students in the group, and has basically just been joy to have around.
Those of us that work in the Community Data Lab at UW is going to miss having Sayamindu around. Chapel Hill is very, very lucky to have him.
The collective has three things on the conference program this year:
Fri, May 25, 9:30 to 10:45, Hilton Prague, LL, Vienna: An Agent-Based Model of Online Community Joining as part of the Computational Methods section paper session on “Agent-Based Modeling for Communication Research” — Jeremy Foote (presenting), Benjamin Mako Hill and Nathan TeBlunthuis
Fri, May 25, 12:30 to 13:45, Hilton Prague, LL, Congress Hall II – Exhibit Hall/Posters: Revisiting ‘The Rise and Decline’ in a Population of Peer Production Projects as part of the Information Systems section’s poster session “ICA Interactive Paper/Poster Session I” —Nathan TeBlunthuis (presenting), Aaron Shaw, and Benjamin Mako Hill
Mon, May 28, 9:30 to 10:45, Hilton Prague, M, Palmovka: Theory Building Beyond Communities: Population-Level Research in the Computational Methods section’s panel on “Communication in the Networked Age: A Discussion of Theory Building through Data-Driven Research” — Benjamin Mako Hill (presenting) and Aaron Shaw
We look forward to sharing our research and socializing with you at ICA! Please be in touch if you’re around and want to meet up!
Seymour Papert is credited as saying that tools to support learning should have “high ceilings” and “low floors.” The phrase is meant to suggest that tools should allow learners to do complex and intellectually sophisticated things but should also be easy to begin using quickly. Mitchel Resnick extended the metaphor to argue that learning toolkits should also have “wide walls” in that they should appeal to diverse groups of learners and allow for a broad variety of creative outcomes. In a new paper, Benjamin Mako Hill and I attempted to provide the first empirical test of Resnick’s wide walls theory. Using a natural experiment in the Scratch online community, we found causal evidence that “widening walls” can, as Resnick suggested, increase both engagement and learning.
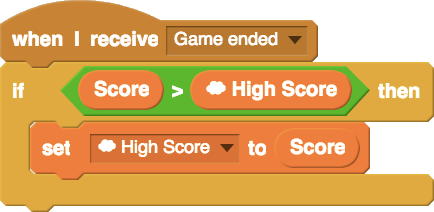
Over the last ten years, the “wide walls” design principle has been widely cited in the design of new systems. For example, Resnick and his collaborators relied heavily on the principle in the design of the Scratch programming language. Scratch allows young learners to produce not only games, but also interactive art, music videos, greetings card, stories, and much more. As part of that team, I was guided by “wide walls” principle when I designed and implemented the Scratch cloud variables system in 2011-2012.
While designing the system, I hoped to “widen walls” by supporting a broader range of ways to use variables and data structures in Scratch. Scratch cloud variables extend the affordances of the normal Scratch variable by adding persistence and shared-ness. A simple example of something possible with cloud variables, but not without them, is a global high-score leaderboard in a game (example code is below). After the system was launched, I saw many young Scratch users using the system to engage with data structures in new and incredibly creative ways.
Example of Scratch code that uses a cloud variable to keep track of high-scores among all players of a game.
Although these examples reflected powerful anecdotal evidence, I was also interested in using quantitative data to reflect the causal effect of the system. Understanding the causal effect of a new design in real world settings is a major challenge. To do so, we took advantage of a “natural experiment” and some clever techniques from econometrics to measure how learners’ behavior changed when they were given access to a wider design space.
Understanding the design of our study requires understanding a little bit about how access to the Scratch cloud variable system is granted. Although the system has been accessible to Scratch users since 2013, new Scratch users do not get access immediately. They are granted access only after a certain amount of time and activity on the website (the specific criteria are not public). Our “experiment” involved a sudden change in policy that altered the criteria for who gets access to the cloud variable feature. Through no act of their own, more than 14,000 users were given access to feature, literally overnight. We looked at these Scratch users immediately before and after the policy change to estimate the effect of access to the broader design space that cloud variables afforded.
We found that use of data-related features was, as predicted, increased by both access to and use of cloud variables. We also found that this increase was not only an effect of projects that use cloud variables themselves. In other words, learners with access to cloud variables—and especially those who had used it—were more likely to use “plain-old” data-structures in their projects as well.
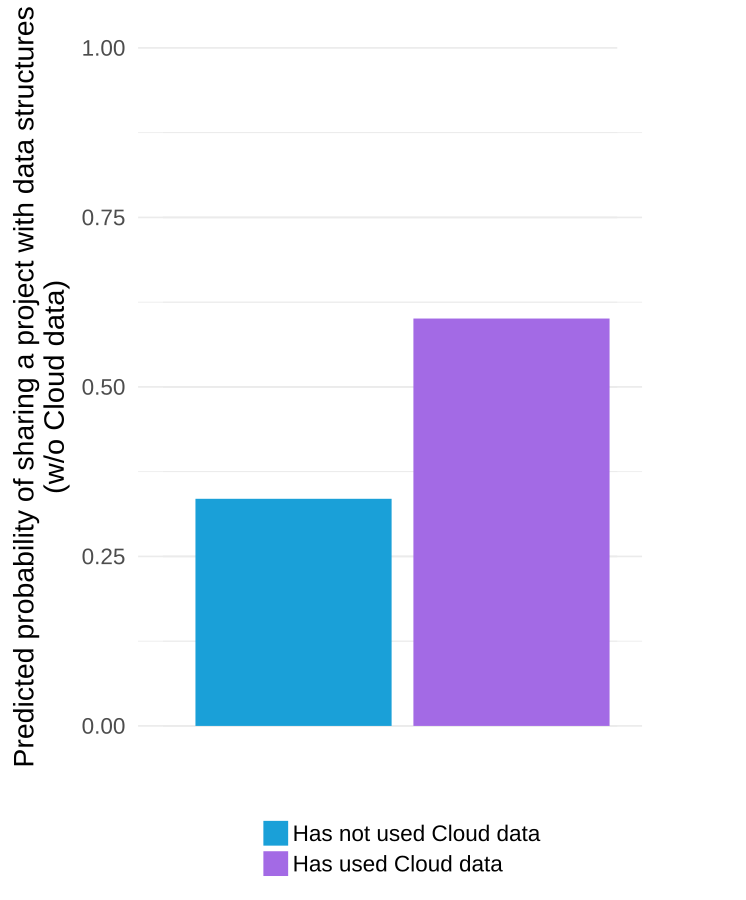
The graph below visualizes the results of one of the statistical models in our paper and suggests that we would expect that 33% of projects by a prototypical “average” Scratch user would use data structures if the user in question had never used used cloud variables but that we would expect that 60% of projects by a similar user would if they had used the system.
Model-predicted probability that a project made by a prototypical Scratch user will contain data structures (w/o counting projects with cloud variables)
It is important to note that the estimated effective above is a “local average effect” among people who used the system because they were granted access by the sudden change in policy (this is a subtle but important point that we explain this in some depth in the paper). Although we urge care and skepticism in interpreting our numbers, we believe our results are encouraging evidence in support of the “wide walls” design principle.
Of course, our work is not without important limitations. Critically, we also found that rate of adoption of cloud variables was very low. Although it is hard to pinpoint the exact reason for this from the data we observed, it has been suggested that widening walls may have a potential negative side-effect of making it harder for learners to imagine what the new creative possibilities might be in the absence of targeted support and scaffolding. Also important to remember is that our study measures “wide walls” in a specific way in a specific context and that it is hard to know how well our findings will generalize to other contexts and communities. We discuss these caveats, as well as our methods, models, and theoretical background in detail in our paper which now available for download as an open-access piece from the ACM digital library.
This blog post, and the open access paper that it describes, is a collaborative project with Benjamin Mako Hill. Financial support came from the eScience Institute and the Department of Communication at the University of Washington. Quantitative analyses for this project were completed using the Hyak high performance computing cluster at the University of Washington.
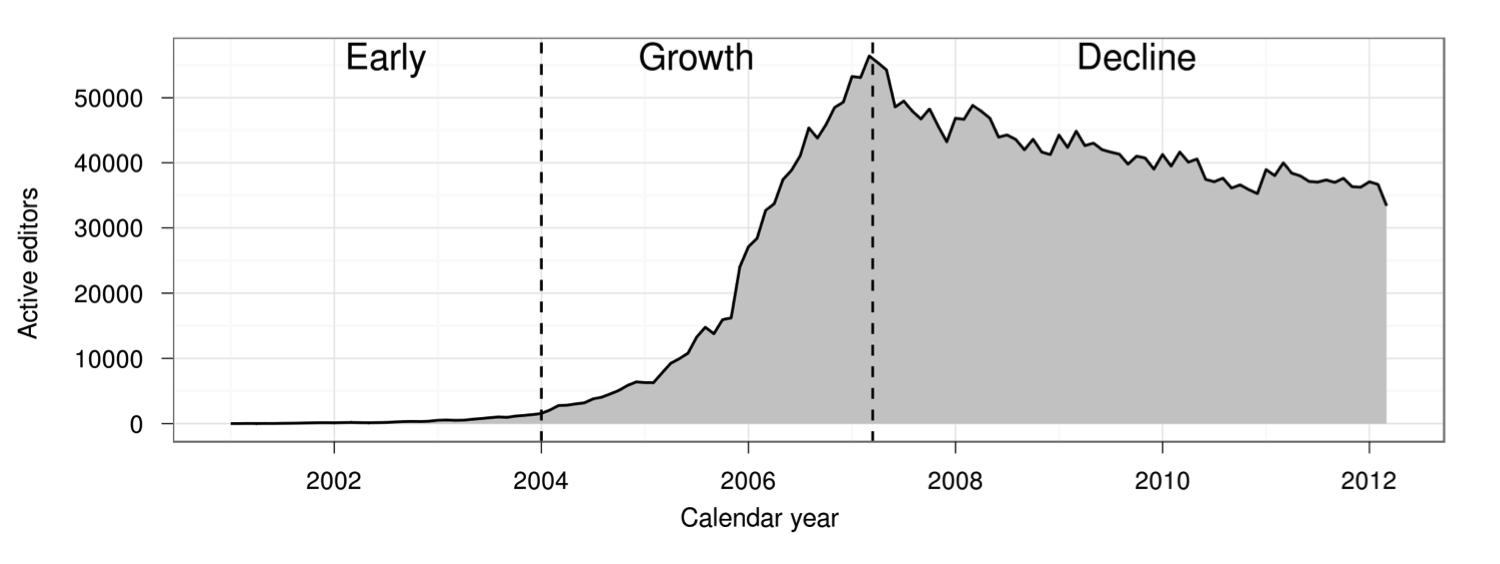
This graph shows the number of people contributing to Wikipedia over time:
The number of active Wikipedia contributors exploded, suddenly stalled, and then began gradually declining. (Figure taken from Halfaker et al. 2013)
The figure comes from “The Rise and Decline of an Open Collaboration System,” a well-known 2013 paper that argued that Wikipedia’s transition from rapid growth to slow decline in 2007 was driven by an increase in quality control systems. Although many people have treated the paper’s finding as representative of broader patterns in online communities, Wikipedia is a very unusual community in many respects. Do other online communities follow Wikipedia’s pattern of rise and decline? Does increased use of quality control systems coincide with community decline elsewhere?
In a paper I am presenting Thursday morning at the Association for Computing Machinery (ACM) Conference on Human Factors in Computing Systems (CHI), a group of us have replicated and extended the 2013 paper’s analysis in 769 other large wikis. We find that the dynamics observed in Wikipedia are a strikingly good description of the average Wikia wiki. They appear to reoccur again and again in many communities.
The original “Rise and Decline” paper (I’ll abbreviate it “RAD”) was written by Aaron Halfaker, R. Stuart Geiger, Jonathan T. Morgan, and John Riedl. They analyzed data from English Wikipedia and found that Wikipedia’s transition from rise to decline was accompanied by increasing rates of newcomer rejection as well as the growth of bots and algorithmic quality control tools. They also showed that newcomers whose contributions were rejected were less likely to continue editing and that community policies and norms became more difficult to change over time, especially for newer editors.
Our paper, just published in the CHI 2018 proceedings, replicates most of RAD’s analysis on a dataset of 769 of the largest wikis from Wikia that were active between 2002 to 2010. We find that RAD’s findings generalize to this large and diverse sample of communities.
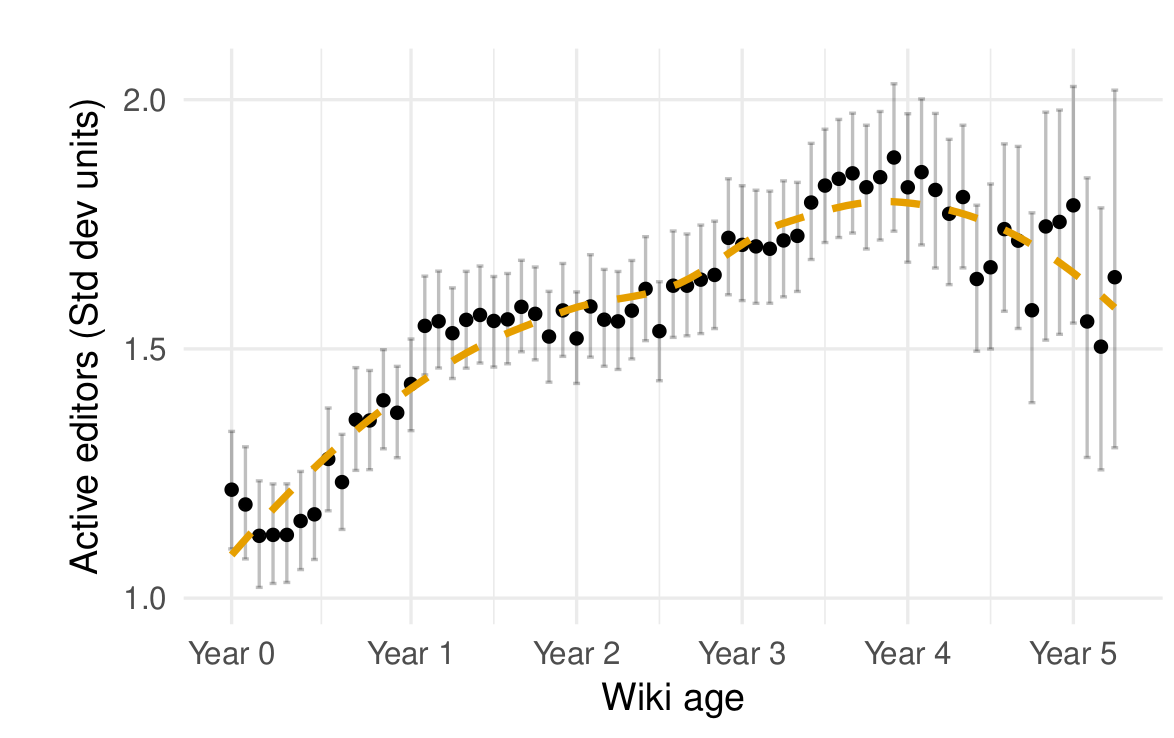
I can walk you through some of the key findings. First, the growth trajectory of the average wiki in our sample is similar to that of English Wikipedia. As shown in the figure below, an initial period of growth stabilizes and leads to decline several years later.
The average Wikia wikia also experience a period of growth followed by stabilization and decline (from TeBlunthuis, Shaw, and Hill 2018).
We also found that newcomers on Wikia wikis were reverted more and continued editing less. As on Wikipedia, the two processes were related. Similar to RAD, we also found that newer editors were more likely to have their contributions to the “project namespace” (where policy pages are located) undone as wikis got older. Indeed, the specific estimates from our statistical models are very similar to RAD’s for most of these findings!
There were some parts of the RAD analysis that we couldn’t reproduce in our context. For example, there are not enough bots or algorithmic editing tools in Wikia to support statistical claims about their effects on newcomers.
At the same time, we were able to do some things that the RAD authors could not. Most importantly, our findings discount some Wikipedia-specific explanations for a rise and decline. For example, English Wikipedia’s decline coincided with the rise of Facebook, smartphones, and other social media platforms. In theory, any of these factors could have caused the decline. Because the wikis in our sample experienced rises and declines at similar points in their life-cycle but at different points in time, the rise and decline findings we report seem unlikely to be caused by underlying temporal trends.
The big communities we study seem to have consistent “life cycles” where stabilization and/or decay follows an initial period of growth. The fact that the same kinds of patterns happen on English Wikipedia and other online groups implies a more general set of social dynamics at work that we do not think existing research (including ours) explains in a satisfying way. What drives the rise and decline of communities more generally? Our findings make it clear that this is a big, important question that deserves more attention.
We hope you’ll read the paper and get in touch by commenting on this post or emailing me if you’d like to learn or talk more. The paper is available online and has been published under an open access license. If you really want to get into the weeds of the analysis, we will soon publish all the data and code necessary to reproduce our work in a repository on the Harvard Dataverse.
I will be presenting the project this week at CHI in Montréal on Thursday April 26 at 9am in room 517D. For those of you not familiar with CHI, it is the top venue for Human-Computer Interaction. All CHI submissions go through double-blind peer review and the papers that make it into the proceedings are considered published (same as journal articles in most other scientific fields). Please feel free to cite our paper and send it around to your friends!
This blog post, and the open access paper that it describes, is a collaborative project with Aaron Shaw, and Benjamin Mako Hill. Financial support came from the US National Science Foundation (grants IIS-1617129, IIS-1617468, and GRFP-2016220885 ), Northwestern University, the Center for Advanced Study in the Behavioral Sciences at Stanford University, and the University of Washington. This project was completed using the Hyak high performance computing cluster at the University of Washington.
If you are at the University of Washington (or not at UW but in Seattle) and are interested in seeing what we’re up to, you can join us for a Community Data Science Collective “open lab” this Friday (April 6th) 3-5pm in our new lab space (CMU 306). Collective members from Northwestern University will be in town as well, so there’s even more reason to come!
The open lab is an opportunity to learn about our research, catch up over snacks and beverages, and pick up a sticker or two. We will have no presentations but several posters describing projects we are working on.
The last decade has seen a massive increase in formality and rigor in quantitative and statistical research methodology in the social scientific study of online communities. These changes have led to higher reliability, increased reproducibility, and increased faith that our findings accurately reflect empirical reality. Unfortunately, these advancements have not come without important costs. When high methodological standards make it harder for scientists to know things, we lose the ability to speak about important phenomena and relationships.
There are many studies that simply cannot be done with the highest levels of statistical rigor. Significant social concepts such as race and gender can never truly be randomly assigned. There are relationships that are rare enough that they can never be described with a p-value of less than 0.05. To understand these phenomena, our methodology must be more relaxed. In our rush to celebrate the benefits of rigor and formality, social scientists are not exploring the ways in which more casual forms of statistical inference can be useful.
To discuss these issues and their impact in social computing research, the Community Data Science Collective will be holding the first ever workshop on Casual Inference in Online Communities this coming October in Evanston, Illinois. We hope to announce specific dates soon.
Although our program remains to be finalized, we’re currently planning to organize the workshop around five panels:
Panel 1: Relaxing Assumptions
A large body of work in statistics has critiqued the arbitrary and rigid “p < .05” significance standard and pointed to problems like “p-hacking” that it has caused. But what about the benefits that flow from a standard of evidence that one out of twenty non-effects can satisfy? In this panel, we will discuss some of the benefits of p-value standards that allow researchers to easily reject the null hypothesis that there is no effect.
For example, how does science benefit from researchers’ ability to keep trying models until they find a publishable result? What do we learn when researchers can easily add or drop correlated measures to achieve significance? We will also talk about promising new methods available to scientists for overcoming high p-values like choosing highly informative Bayesian priors that ensure credible intervals far away from 0. We will touch on unconstrained optimization, a new way of fitting models by “guesstimating” parameters.
Panel 2: Exputation of Missing Data
Missing data is a major problem in social research. The most common ways of addressing missing data are imputation methods. Of course, imputation techniques bring with them assumptions that are hard to understand and often violated. How might types of imputation less grounded in data and theory help? How might we relax assumptions to infer things more casually about data—and with data—that we can not, and will not, ever have? How can researchers use their beliefs and values to infer data?
Our conversation will focus on exputation, a new approach that allows researches to use their intuition, beliefs, and desires to imagine new data. We will touch on multiple exputation techniques where researchers engage in the process repeatedly to narrow in on desired results.
Panel 3: Quasi-Quasi Experiments
Not every study can be at the scientific gold standard of a randomized control experiment. The idea of quasi-experiments are designed to relax certain assumptions and requirements in order to draw similar types of inference from non-experimental settings. This panel will ask what might we gain if we were relax things even more.
What might we learn from quasi-quasi experiments, where shocks aren’t quite exogenous (and might not even be that shocking)? We also hope to discuss superficial intelligence, post hoc ergo propter hoc techniques, supernatural experiments, and symbolic matching based on superficial semantic similarities.
Panel 4: Irreproducible Results
Since every researcher and every empirical context is unique, why do we insist that the same study conducted by different researchers should not be? What might be gained from embracing, or even pursuing, irreproducible methods in our research? What might we see if we allow ourselves to be the giants upon whose shoulders we stand?
Panel 5: Research Ethics
[Canceled]
Although we are hardly the first people to talk about casual inference, we believe this will be the first academic meeting on the topic in any field. Please plan to join us if you can!
If you would like to apply to participate, please send a position paper or extended abstract (no more than 1000 words) to casualinference@communitydata.cc. We plan to post a list of the best submissions.
Many organizations have unprecedented access to data, experiments, and statistical inference. The diffusion of these resources has created pressure to develop the skills and practices necessary to use them. However, the distribution of these skills and practices has an organizational component, leading some teams and organizations to harness social scientific insights far more effectively than others.
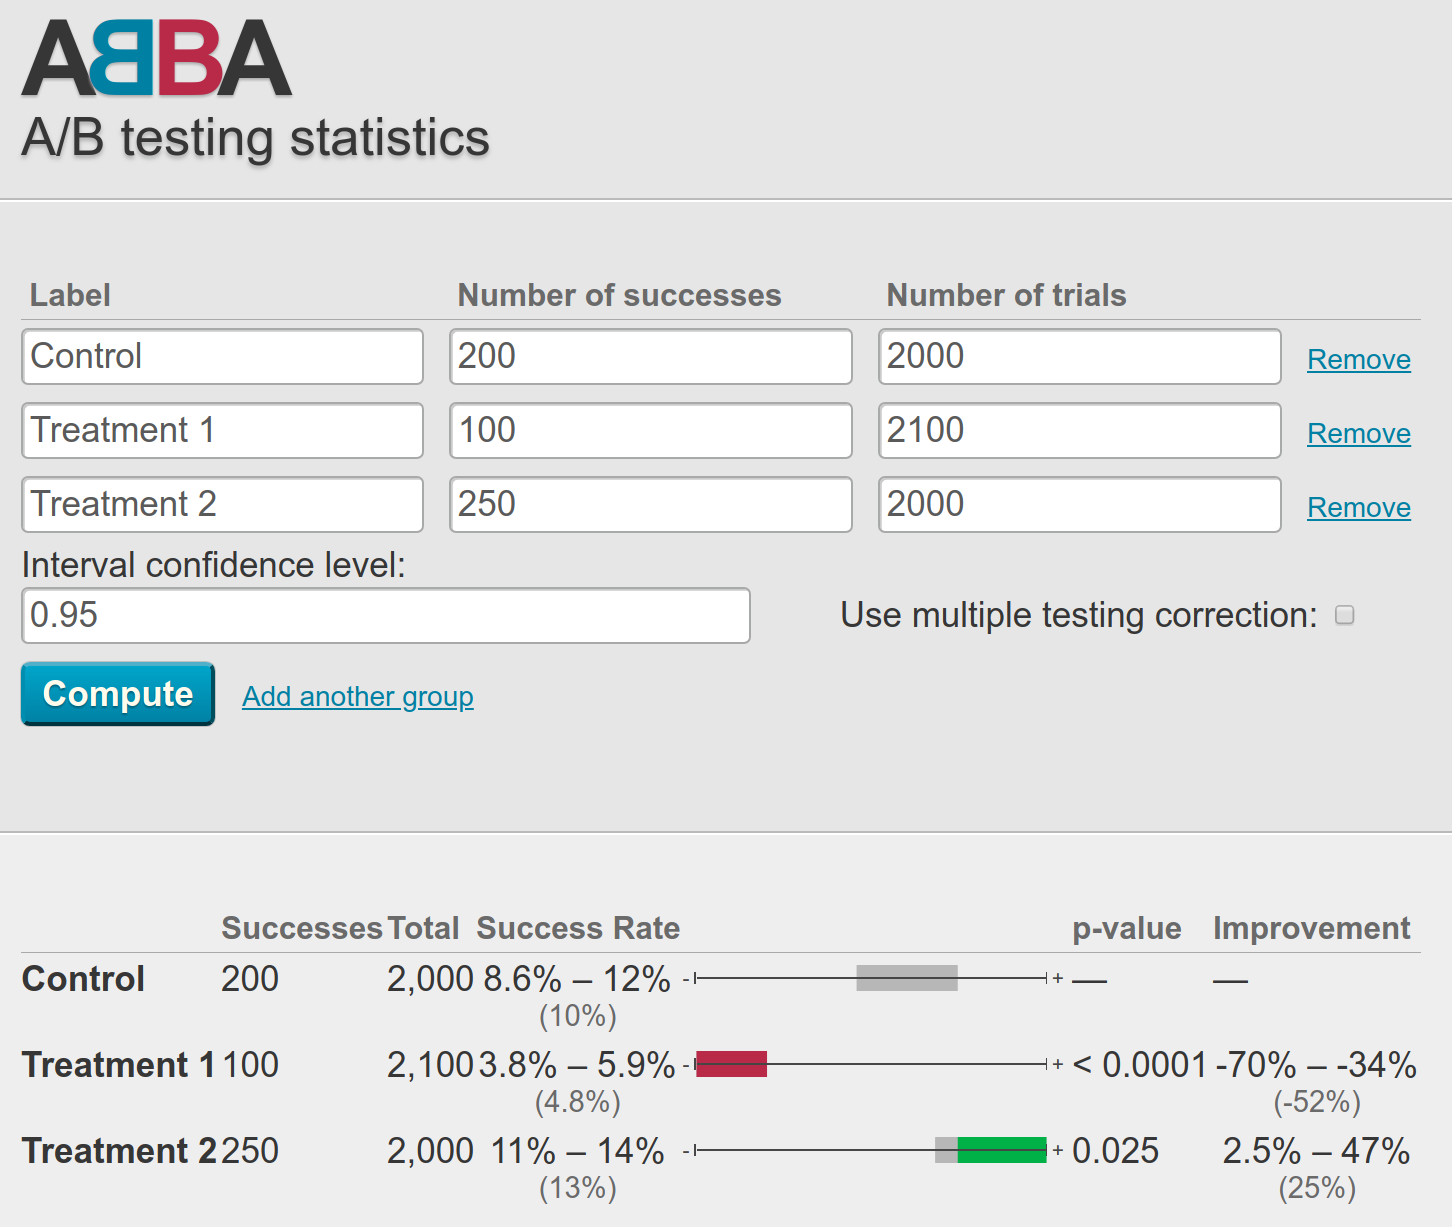
Handy web-based tools like ABBA can make a-b testing more accessible
We hear plenty about examples of “bad” statistics in the news. For example, Brian Wansink and the Cornell Food Lab have gotten a whole lot of attention for problems in their statistical analysis and interpretation. More than sheer ignorance or malfeasance (although there may be some evidence of that too), I think the reproducibility crisis illustrates how pervasive pressure to produce statistical evidence has combined with uneven professional standards can lead to dodgy research.
Our capacity to gather data and apply inferential statistics may have gotten ahead of our collective ability to manage these resources skillfully. In academia, this might lead to publications with spurious findings. In other kinds of environments, it might lead to decisions based on evidence of questionable quality. In both cases organizational resource constraints and communication challenges shape whether, where, and how well data science and statistics get done.
A slightly long story illustrates how this can play out in a non-academic environment, specifically a fairly small technology company. I share the story as a cautionary tale that can hopefully provoke some useful reflection about how we (people who care about evidence-based decision making, data science, statistics, and applied social science) can improve our work. I have de-identified the organization and the individuals involved because this is really not about them per se. The challenges they face are common. I think the story can tell us something interesting about those challenges.
Within the organization, several teams conduct experiments, user tests, and other sorts of data-intensive, social scientific research. One of these teams had reached out because they had some questions about methods of analysis. Within the organization, this particular team had gotten positive feedback for their adoption of a data-driven pipeline of A/B testing, but there were concerns about whether the testing was being done well. I went to visit them planning to do a little bit of informal statistical consulting and to learn more about that part of the organization.
A few team members walked me through a typical field experiment with multiple (about 10) treatment conditions. Everything runs on a small stack of custom scripts that pulled summary data from the platform’s databases. The team uses spreadsheets to record the number of individuals assigned to each condition along with the number of “successful” trials (e.g., cases where an end-user has the desired response to a given design change).
The team then enters the raw summary information into an open source web-based tool called ABBA that runs some calculations and reports a “success rate” (a smoothed percentage) for each trial, a raw and percentage-based confidence interval for the success rate, and a p-value (based on a binomial cumulative distribution function or a normal approximation for large samples). ABBA also presents a handy little visualization plotting the interval estimated for each experimental condition along a bar colored either gray (not different from control), red (lower success rate than control), or green (higher success rate than control) depending on the results of the corresponding hypothesis test. I’ve included a screenshot of what this looks like at the top of the post and you can try it yourself.
Those of you with a statistical background following me into the weeds here might be nodding and thinking “okay, sounds maybe not ideal, but reasonable enough.” While the system puts too much faith in p-values, it follows a pretty standard approach. It’s also a great example of the kind of statistics-as-a-service approach to A/B testing that many organizations have adopted in response to various pressures to be more data driven.
That’s when things started to get weird. As we spoke more, it turned out that the ways members of the team conduct the tests, enter the data, and interpret the results raise major red flags.
For example, they regularly update the number of experimental conditions on-the-fly, dropping old conditions and adding new conditions when others already had thousands of observations (ABBA makes this super easy!).
When experimental conditions are dropped or added, the team routinely re-computes statistical tests and p-values with/without the new/old observations included. Mostly, conditions that do not seem to produce different outcomes from the control were silently removed from the analysis.
For some of the analysis itself, the team uses parametric tests that assume normal distributions on heavily skewed data.
Then, when it comes time to interpret the results, the analysts use the relative magnitude of p-values as an estimate of the magnitude of conditional effect sizes.
At this point, those of you with relevant training in applied statistics, experimental research methods, data science, etc. might be scratching your heads or experiencing full-on panic.
Separately, each of these steps are inferential howlers capable of invalidating results. Together, they render whatever results were coming out of this process untrustworthy in the extreme.
For the rest of the meeting, I did my best to identify a series of steps the team could take to avoid the problems above. But I still walked away disconcerted. This was a technically sophisticated organization with plenty of resources. The team was using a pretty well-designed tool for analyzing experimental data. They had gotten critical feedback on the work they were doing. How did a situation like this happen?
The individuals on the team were doing their best. Nobody is born with deep knowledge of applied statistics. Confronted with a challenging mandate from their supervisors, these people were all doing their absolute best to apply some tools they didn’t fully understand to solve a practical problem. They had generally been told that their work was good, knew they had some issues to fix, and reached out to someone with more knowledge (in this case me) for help.
What about the tools? Can we at least blame the tools? As I mentioned earlier, a bunch of companies are in the business of providing “statistics-as-a-service” or A/B testing platforms, but I’m not convinced that these are the root of the problem either. Sure, ABBA makes some mistakes a little too easy, but the tool was also built and shared by skilled data scientists who painstakingly documented everything before distributing it on GitHub. Their documentation is why I was able to sort out exactly what was happening in the first place and help the team members understand some of the issues involved. Indeed, nothing seems obviously or fundamentally wrong with the implementation of the underlying software or the statistical tests. Instead, the misuse of the system happened despite the software designers’ best efforts.
Here we get into one problem area: the incentives to produce specific kinds of outcomes. The team using the tool needed to run experiments and interpret them as decisive “wins” or “losses.” The reality was much less clear and, in this way, the p-values obscured some of that ambiguity. Imposing a dichotomous logic on experimental evidence is often impossible and will, even under the best conditions, lead to systematic abuses of statistical reasoning.
What about the organizational leadership then? Shouldn’t they be responsible for making sure that the company does high quality data science? On the one hand yes, and on the other hand, this is hard too and understandable problems arise. Executives and managers often lack the requisite statistical expertise to evaluate operations like this in a rigorous way. They have heard, through professional networks, industry publications, media, etc., that more data and more A/B tests are Good Things for their organization. At a certain point, they cannot do the auditing of experimental procedures and inference themselves.
Shouldn’t the managers just make sure someone else can audit the statistics then? This is probably where the most important breakdowns occurred. Turns out that other staff possess all the skills to diagnose and repair the issues I identified (and more). One of these people had even been assigned to work with the team in question for a while! However, that assignment had ended during a restructuring and statistical expertise had never returned to the team. In the meantime, managers continued to demand results without fully appreciating that the existing approach had deep problems.
So given this particular mix of data and organizational sciences gone awry, what lessons can we learn?
The future of data-intensive social science remains, as William Gibson might say, unevenly distributed. As the infrastructure for data collection and analysis has become more widely accessible, the choke-point in many organizations has become the dissemination of deeper knowledge of the techniques necessary to produce valid, reliable inference. These inequalities emerge both within and between organizations. Some companies and some teams have more expertise than others. Some have more effective systems for feedback and improvement than others.
In this sense, organizational (not just technical or statistical) obstacles stand in the way of more effective, accountable, and transparent uses of evidence to make decisions. Web-scale organizations can run 100,000 randomized trials and analyze the results very quickly. The results can look real and have p-values attached and the executives can believe that they have got the whole data science thing nailed down. However, the analysis might not mean much unless it is implemented skillfully.
The inundation of behavioral trace data does not guarantee that we will be similarly inundated by reliable findings, valid inference, or skilled implementation. High quality research design and interpretation may not scale so easily as the data or the analysis tools.
All of this has distributive implications. Organizations with access to the best social scientific knowledge as well as the organizational capacity to deploy and harness that knowledge will be the ones most likely to reap benefits from it. Others, such as many public administrations in the U.S. (especially those that deliver social services), smaller firms, non-profits, and community organizations will likely get inferior inference (to the extent they get any at all).
It takes time and effort to build organizational resources and cultures capable of supporting widespread, high quality, data-driven inference. Some recent work in HCI and related fields speaks to these issues. For example, some folks at CU Boulder have a 2017 CHI paper about how mission-driven organizations can struggle to do data-driven work. In a more interventionist vein, Catherine D’Ignazio and Rahul Barghava have launched the Data Culture Project in an effort to help smaller non-profits and community organizations use data more effectively.
Whatever the organizational context, high quality social scientific and statistical work requires more than just a clear understanding of p-values and massive A/B testing infrastructure. Statistical expertise also needs to be embedded and managed effectively within organizations and teams in order to produce reliable inference.
This is a cross-post from the CASBS Medium channel. Thanks to members of the CDSC, Margaret Levi, and some anonymous friends for feedback on earlier versions of the text.
The ubiquity of large-scale data and improvements in computational hardware and algorithms have provided enabled researchers to apply computational approaches to the study of human behavior. One of the richest contexts for this kind of work is social media datasets like Facebook, Twitter, and Reddit.
We were invited by Jean Burgess, Alice Marwick, and Thomas Poell to write a chapter about computational methods for the Sage Handbook of Social Media. Rather than simply listing what sorts of computational research has been done with social media data, we decided to use the chapter to both introduce a few computational methods and to use those methods in order to analyze the field of social media research.
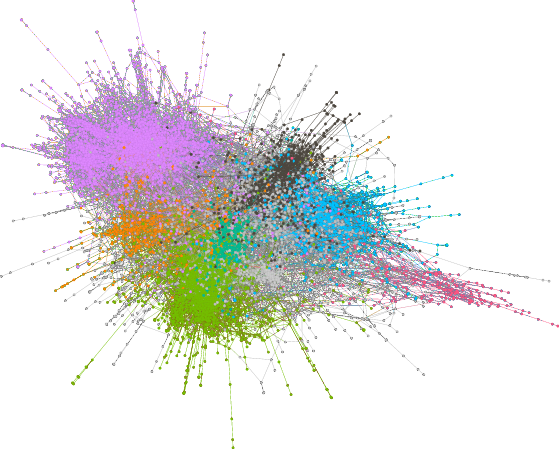
A “hairball” diagram from the chapter illustrating how research on social media clusters into distinct citation network neighborhoods.
Explanations and Examples
In the chapter, we start by describing the process of obtaining data from web APIs and use as a case study our process for obtaining bibliographic data about social media publications from Elsevier’s Scopus API. We follow this same strategy in discussing social network analysis, topic modeling, and prediction. For each, we discuss some of the benefits and drawbacks of the approach and then provide an example analysis using the bibliographic data.
We think that our analyses provide some interesting insight into the emerging field of social media research. For example, we found that social network analysis and computer science drove much of the early research, while recently consumer analysis and health research have become more prominent.
More importantly though, we hope that the chapter provides an accessible introduction to computational social science and encourages more social scientists to incorporate computational methods in their work, either by gaining computational skills themselves or by partnering with more technical colleagues. While there are dangers and downsides (some of which we discuss in the chapter), we see the use of computational tools as one of the most important and exciting developments in the social sciences.
Steal this paper!
One of the great benefits of computational methods is their transparency and their reproducibility. The entire process—from data collection to data processing to data analysis—can often be made accessible to others. This has both scientific benefits and pedagogical benefits.
To aid in the training of new computational social scientists, and as an example of the benefits of transparency, we worked to make our chapter pedagogically reproducible. We have created a permanent website for the chapter at https://communitydata.science/social-media-chapter/ and uploaded all the code, data, and material we used to produce the paper itself to an archive in the Harvard Dataverse.
Through our website, you can download all of the raw data that we used to create the paper, together with code and instructions for how to obtain, clean, process, and analyze the data. Our website walks through what we have found to be an efficient and useful workflow for doing computational research on large datasets. This workflow even includes the paper itself, which is written using LaTeX + knitr. These tools let changes to data or code propagate through the entire workflow and be reflected automatically in the paper itself.
If you use our chapter for teaching about computational methods—or if you find bugs or errors in our work—please let us know! We want this chapter to be a useful resource, will happily consider any changes, and have even created a git repository to help with managing these changes!
 The
The