In The Modem World, Driscoll provides an engaging social history of Bulletin Board Systems (BBSes), an early, dial-up precursor to social media that predated the World Wide Web. You might have heard of the most famous BBSes—likely Stuart Brand’s Whole Earth ‘Lectronic Link, or the WELL—but, as Driscoll elaborates, there were many others. Indeed, thousands of decentralized, autonomous virtual communities thrived around the world in the decades before the Internet became accessible to the general public. Through Driscoll’s eyes, these communities offer a glimpse of a bygone sociotechnical era and that prefigured and shaped our own in numerous ways. The “modem world” also suggests some paths beyond our current moment of disenchantment with the venture-funded, surveillance capitalist, billionaire-backed platforms that dominate social media today.
The book, like everything of Driscoll’s that I’ve ever read, is both enjoyable and informative and I recommend it for a number of reasons. I also (more selfishly) recommend the book review, which was fun to write and is just a few pages long. I got helpful feedback along the way from Yibin Fan, Kaylea Champion, and Hannah Cutts.
Because IJOC is an open access journal that publishes under a CC-BY-NC-ND license, you can read the review without paywalls, proxies, piracy, etc. Please feel free to send along any comments or feedback! For example, at least one person (who I won’t name here) thinks I should have emphasized the importance of porn in Driscoll’s account more heavily! While porn was definitely an important part of the BBS universe, I didn’t think it was such a central component of The Modem World. Ymmv?
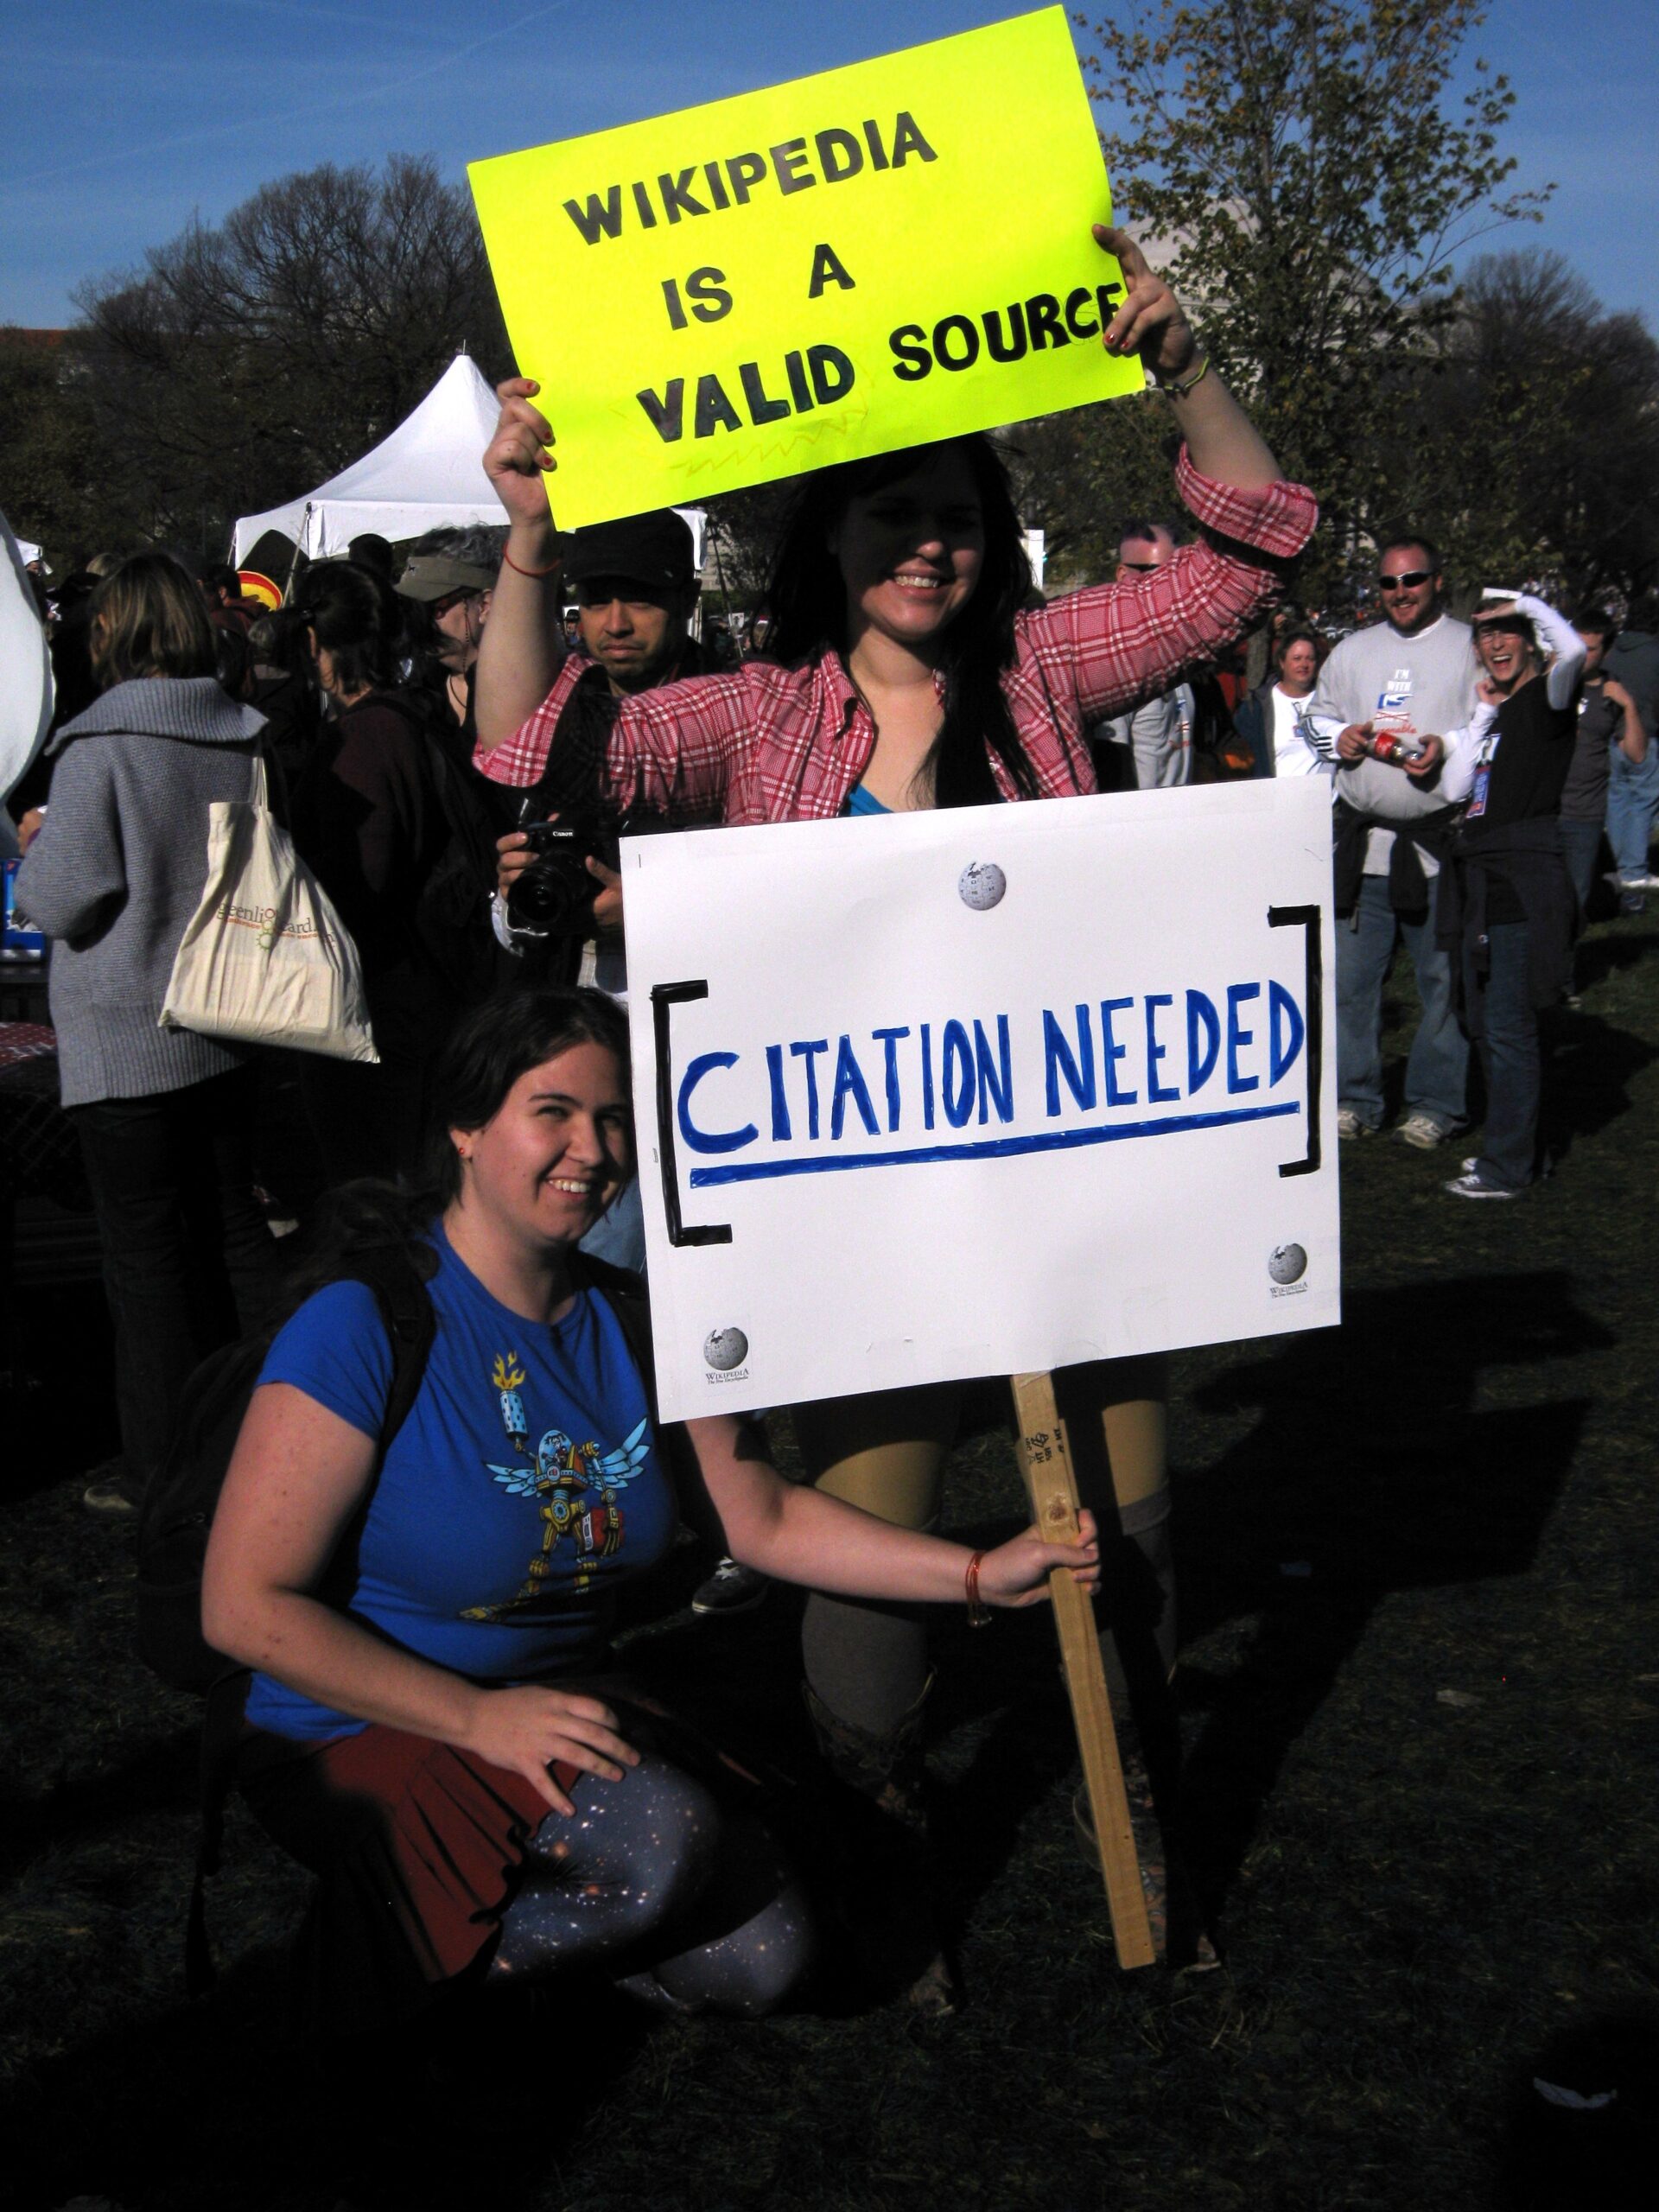
Two participants of the “Rally to Restore Sanity and/or Fear” in Washington D.C. (USA), holding signs saying “Wikipedia is a valid source” and “citation needed.” October 30, 2010. Kat Walsh (User:Mindspillage), CC BY-SA 3.0 https://creativecommons.org/licenses/by-sa/3.0, via Wikimedia Commons
Wikipedia provides the best and most accessible single source of information on the largest number of topics in the largest number of languages. If you’re anything like me, you use it all the time. If you (also like me) use Wikipedia to inform your research, teaching, or other sorts of projects that result in shared, public, or even published work, you may also want to cite Wikipedia. I wrote a short tutorial to help people do that more accurately and effectively.
The days when teachers and professors banned students from citing Wikipedia are perhaps not entirely behind us, but do you know what to do if you find yourself in a situation where it is socially/professionally acceptable to cite Wikipedia (such as one of my classes!) and you want to do so in a responsible, durable way?
More specifically, what can you do about the fact that any Wikipedia page you cite can and probably will change? How do you provide a useful citation to a dynamic web resource that is continuously in flux?
This question has come up frequently enough in my classes over the years, that I drafted a short tutorial on doing better Wikipedia citations for my students back in 2020. It’s been through a few revisions since then and I don’t find it completely embarrassing, so I am blogging about it now in the hopes that others might find it useful and share more widely. Also, since it’s on my research group’s wiki, you (and anyone you know) can even make further revisions or chat about it with me on my user:talk page.
You might be thinking, "so wait, does this mean I can cite Wikipedia for anything"??? To which I would respond "Just hold on there, cowboy."
Wikipedia is, like any other information source, only as good as the evidence behind it. In that regard, nothing about my recommendations here make any of the information on Wikipedia any more reliable than it was before. You have to use other skills and resources to assess the quality of the information you’re citing on Wikipedia (e.g., the content/quality of the references used to support the claims made in any given article).
Like I said above, the problem this really tries to solve is more about how to best cite something on Wikipedia, given that you have some good reason to cite it in the first place.
In The Wealth Of Networks, Yochai Benkler describes the opportunities and decisions presented by networked forms of production. Writing in the mid-2000s, Benkler describes a wide range of future policy battlegrounds: copyrights and patents, common carrier infrastructure, the accessibility of the public sphere, and the verification of information.
Benkler predicts: “How these battles turn out over the next decade or so will likely have a significant effect on how we come to know what is going on in the world we occupy, and to what extent and in what forms we will be able…to affect how we and others see the world as it is and as it might be.”
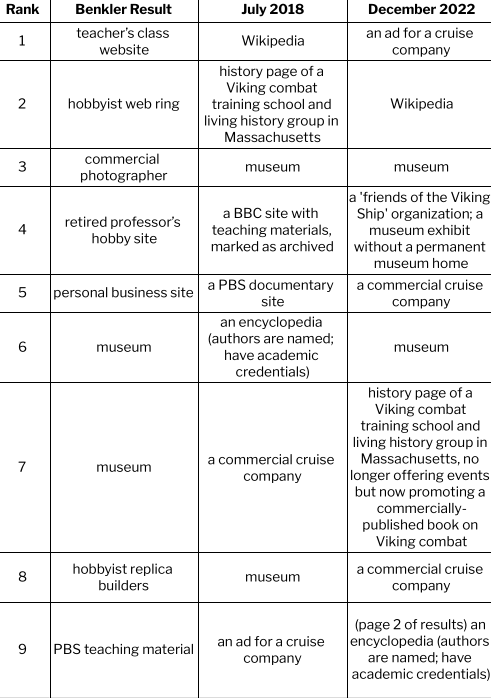
Benkler uses two simple search examples, reporting the results of searching for “Viking ship” and “Barbie”. He finds that enthusiastic individuals and independent voices dominate the content we see on the web and that various search engines construct meaning in varying ways. I repeat his examples (searches conducted 7/3/2018 and 12/1/2022, from my home near Seattle, WA and using my personal laptop).
So how do ‘we come to know what is going on in the world we occupy’? Who creates what we see online? And what implications does that have for our own freedom to shape the world? The short version of the answer to this question seems to be: if there was a battle, it’s over now and the wreckage has disappeared; individuals and independent voices are marginalized and commercial content is dominant — and this picture does not vary among search engines.
Viking Ships
I used the same search engine (Google) and the same term (Viking Ship): what I see is that the individual hobbyists Benkler saw in 2006 are eclipsed by institutions. The materials on the current sites sound similar to those Benkler saw – photos, replicas, and scholarly information, as well as links and learning materials – but the production is generally institutional and formal in contrast to the individual and informal sources Benkler reports.
One other shift: in 2022, simply listing links in order is not sufficient to report what searchers see. Search results are interspersed with many other features: a widget with “sources from across the web”, an images display with associated keywords, a “People also ask” widget, and a related searches widget; to reach the 9th “result” in the classic sense, I have to browse to the second page of results.
Searching for ‘Viking Ship’ in 2006, 2018, and 2022
Barbie
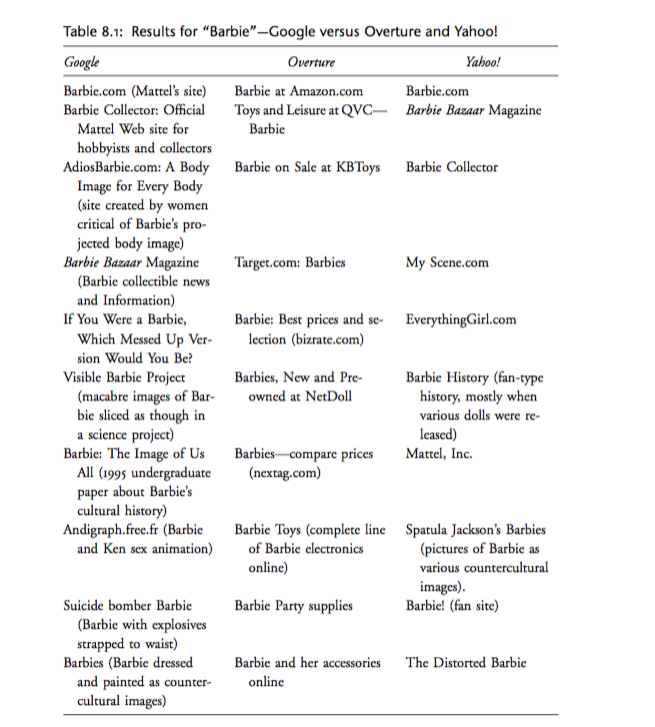
When I follow Benkler’s lead and search for ‘Barbie’ using three different search engines, the results are even more different from 2006. Benkler describes differences in search engine results as revealing different possibilities – via Google, Barbie was portrayed as “a culturally contested figure”, whereas on Overture (a now-defunct shopping-oriented search engine), the searcher encountered “a commodity toy.”
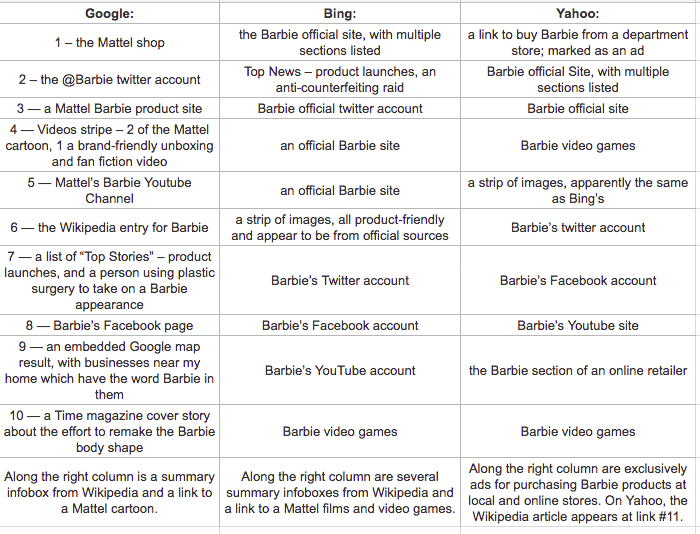
By contrast, my 2018 search via the then-current top 3 search engines, inclusive of widgets and other features, revealed:
Searching for ‘Barbie’ via the top 3 search engines in 2018.
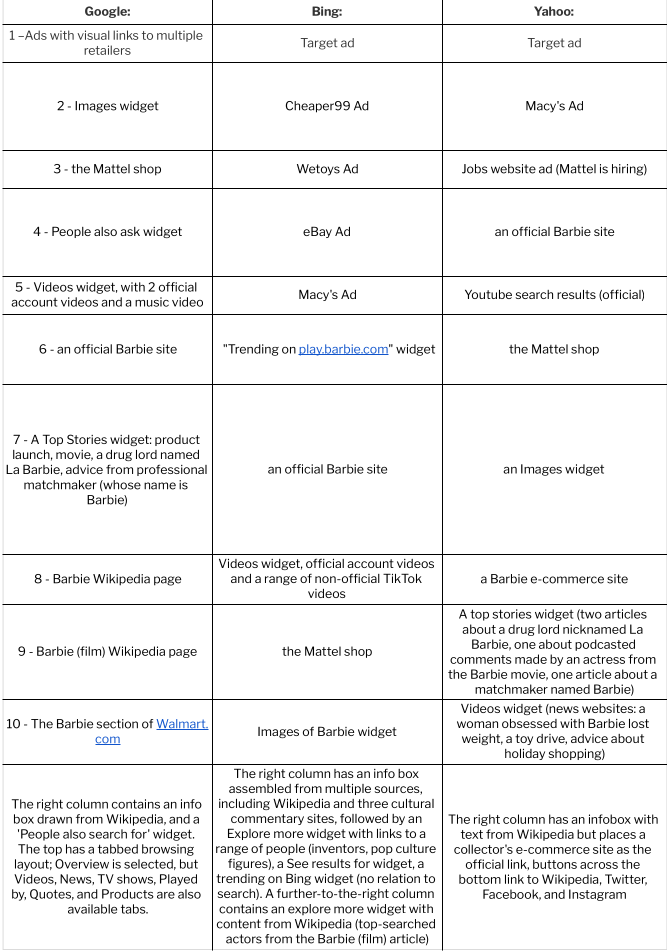
The top search engines in 2022 are the same three firms, although I observe that some sources suggest DuckDuckGo, Baidu (Chinese language only) and Yandex (Russian) belong in a top 5; other sources treat YouTube and Amazon as “top search engines” although they are not actually search engines. My 2022 search, inclusive of widgets and other features, revealed:
Searching for ‘Barbie’ via the top 3 search engines in 2022.
The modern Barbie searcher encounters primarily a multiplatform brand, with some hints of cultural constructions. In 2018 this took the form of extreme plastic surgery and brand-friendly fan fiction, in 2022 weight loss and fan TikTok. To whatever degree search engine algorithms continue to give weight to alternate voices in this case, they are largely drowned out by the volume of the commercial voice: the meaning of a search query for the single term “Barbie” has been substantially narrowed since Benkler’s time, and perhaps has narrowed even further in the last four and a half years.
The web in 2006 was indeed a different place, and I have commented on additional dimensions of analysis not present in Wealth: embedding of visual and social media content, and the widgetizing of content. In 2018, these visual components were less dominant: a stripe of Viking Ship images and a stripe of Barbie videos. In 2022 search, the page can scarcely be described without them.
We can now answer Benkler’s challenge: how did “these battles” over the last decade and a half “turn out”?
How do we “come to know what is going on in the world we occupy”?
How are we able “to affect how we and others see the world as it is and as it might be”?
The answer seems to be, it’s unclear to what degree there was a battle at all: collectives have triumphed over individuals on the Web insofar as search engines represent it. These collectives are generally firms, although some formal institutions are also present: news media, Wikipedia, and (in the case of Viking Ship) museums.
The implications of our search environment are significant, and underscore the necessity of efforts to archive and capture the search landscape as it appeared. The role of platforms and institutions in constructing our understanding of the world should be of key concern in information and communication sciences.
For civil society groups, these results suggest alienation: the commercializing of the web has been accompanied by a narrowing of outlets for individual expression and critique, with Wikipedia and its community co-construction of knowledge a vital bright spot. For journalists, these results suggest the vital role of cultural reporting. For firms, the challenge is one of authenticity and connection: to the extent that the web has become a broadcast medium focused on official paid messaging, the opportunity to engage with consumers is lost, and along with it a spark for innovation. Search platforms benefit in the mean time, as jockeying for ad positioning between manufacturers and retailers drives revenue, at least until commercialism turns consumer attention elsewhere.
CSCW 2021 introduced Lab Speed Dating wherein labs were matched and given an hour to get to know each other. Sohyeon Hwang organized our first lab date. It was so much fun we decided to go on more in order to meet other groups. I wanted to share a bit about this and our process in case you are interested in trying it out or want to have a meetup with us.
After the initial CSCW Lab Date we made a very long list of other labs we want to meet and have (slowly) been inviting them to come by. We also included individual researchers, people who collaborate in smaller, informal groups, co-authors, and corporate research teams.
We use our “softblock” to schedule meetings, rather than finding a new time for each meeting. The CDSC maintains a softblock, which is a block of time for whatever comes up, one-off meetings we need to schedule, and co-working sessions. (Today I am using the softblock to write this blog post!)
We are pretty open to different structures for our lab dates. So far the ones with full labs have been divided into two parts: 1) everyone introduces themselves as briefly as we can manage and then 2) we break out into small groups for short periods of time to talk. We try to cycle through 2-3 of these breakouts, depending on how many people are in attendance. When meeting with individuals, our guests typically present a piece of work that we workshop or discussed their interests in a more general sense and we talk about them as a whole group. We are open to other models, but nothing has come up yet.
Blocks have focused around networking and getting to know other researchers on a professional level. Because we have been attending fewer in-person events, we have had fewer chances to meet new people. Even at events it can be hard to connect with the people you want to meet and it is very hard (for us) to have everyone from the CDSC in a space together with another group.
If you are interested in going on a lab date with us, you can message me on IRC or email me (details here). We have a lot of open spots for the rest of the quarter and one of them could be yours!
In May 2019, we were invited to give short remarks on the impact of Janet Fulk and Peter Monge at the International Communication Association‘s annual meeting as part of a session called “Igniting a TON (Technology, Organizing, and Networks) of Insights: Recognizing the Contributions of Janet Fulk and Peter Monge in Shaping the Future of Communication Research.”
Youtube: Mako Hill @ Janet Fulk and Peter Monge Celebration at ICA 2019
Mako Hill gave a four-minute talk on Janet and Peter’s impact to the work of the Community Data Science Collective. Mako unpacked some of the cryptic acronyms on the CDSC-UW lab’s whiteboard as well as explaining that our group has a home in the academic field of communication, in no small part, because of the pioneering scholarship of Janet and Peter. You can view the talk in WebM or on Youtube.
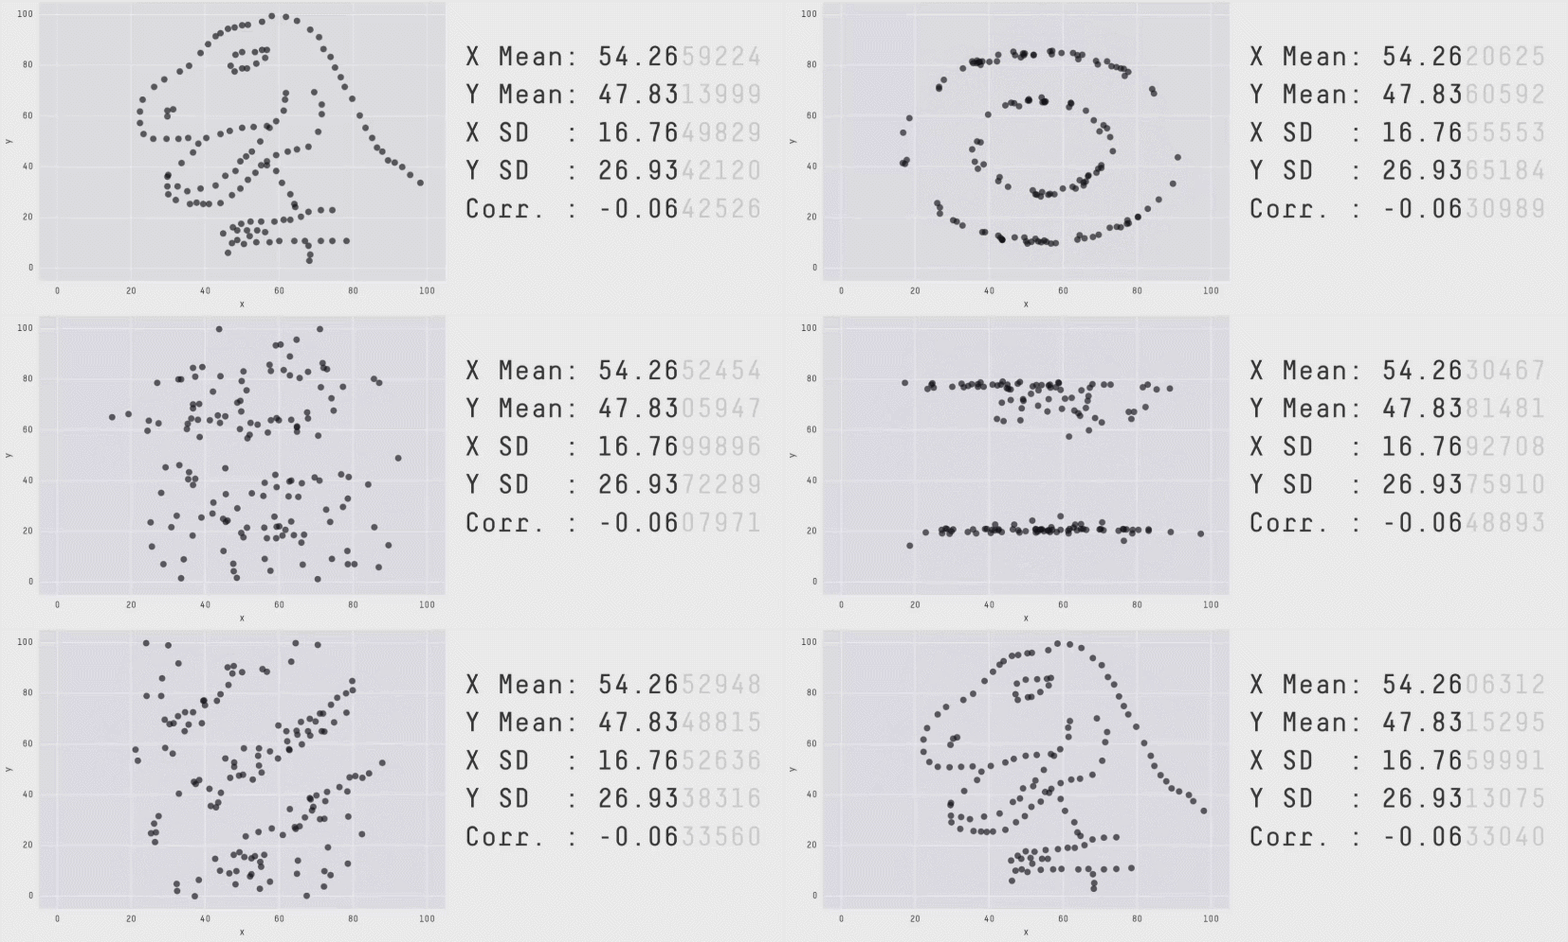
Why learning some statistics and some data visualization matters. (Gif from Matejka and Fitzmaurice, “Same stats, different graphs”, CHI 2017: https://dl.acm.org/citation.cfm?id=3025912)
I taught a graduate-level introduction to applied statistics and statistical computing this past Spring. The course design iterated on a class Mako developed in 2017. Very nearly all of the course materials are available open access through the Community Data Science Collective wiki and I wanted to make sure to share them more widely with this post. I’ve also been reflecting a bit on how the course went and thought I’d share those thoughts here in case anyone wants to adopt the course in the future.
First off, the course uses the OpenIntro Statistics (3rd edition) textbook as the core of the course readings and assignments. If you’re not familiar with OpenIntro and you want to learn or teach applied statistics from a general, social scientific perspective, you should check it out! All of the data, code, and LaTeX used to produce the textbook is licensed freely for reuse and the site also hosts video lectures, lecture notes, homework assignments, a discussion forum and more.
Alongside the OpenIntro materials, I worked together with Jeremy Foote (who was the TA for the course before he left to be new faculty at Purdue) to develop a bunch of tutorials in RMarkdown to help students complete the problem set assignments. We also posted worked solutions to the problem sets (also in RMarkdown). These replicated and expanded on screencasts Mako had recorded for his course.
The classroom sessions focused on discussion and problem solving. Basically, students came to each session knowing that I expected them to have completed the problem sets. I then did my best to answer any questions people had and assigned individuals (in some cases using a randomization script in R to pick names!) to summarize their solutions and approaches to specific problems that seemed important to cover.
It was my first time teaching a course like this and I had a few reflections after completing the quarter and reading through the feedback from students.
A major challenge for a course like this is pitching the material to an appropriate level given that students (in the MTS and TSB programs here at Northwestern at least) arrive with such varied knowledge of the subject matter. I think I did okay on this front in some ways and not in others. It was especially challenging given the semi-flipped classroom approach.
In some weeks, there was just too much material to cover in adequate depth. In some others, I was insufficiently organized and concise to cover everything. Whatever the case, I would cut back a bit next time. (I’ve noticed that this is a common issue for me the first time I teach any class, but I still struggle to correct it.)
Whatever challenges and failures I may have introduced in the design or instruction of the course, the students produced a bunch of highly original and engaging final projects. I’m optimistic that some of these projects will wind up as published work soon. Nothing like brilliant, motivated students to help the professor feel better about his own shortcomings!
Nearly all of the course materials are available on the CDSC wiki. The exceptions are a few of the readings and supplementary materials that I didn’t have the rights or desire to post on the public web. If you’re looking for any of that, feel free to send me an email and I can see if it’s appropriate to share.
Also, OpenIntro just came out with the fourth edition of their statistics textbook! I haven’t had a chance to check it out yet, but I’m eager to see what kinds of changes they introduced.
This post was co-authored by Benjamin Mako Hill and Aaron Shaw. We wrote it following a conversation with the CSCW 2018 papers chairs. At their encouragement, we put together this proposal that we plan to bring to the CSCW town hall meeting. Thanks to Karrie Karahalios, Airi Lampinen, Geraldine Fitzpatrick, and Andrés Monroy-Hernández for engaging in the conversation with us and for facilitating the participation of the CSCW community.
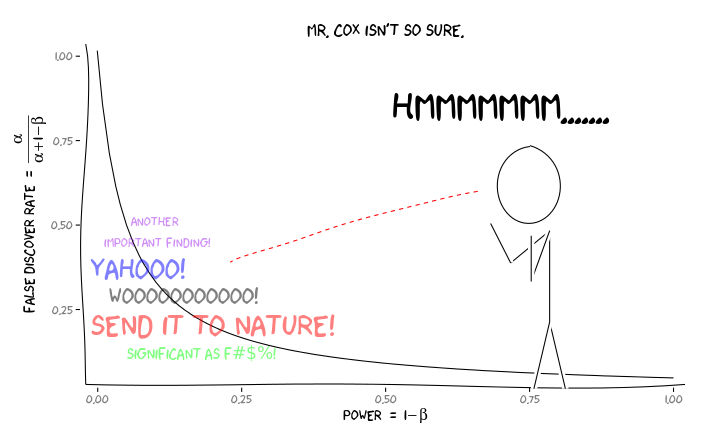
Quantitative methodologists argue that the high rates of false discovery are, among other reasons, a function of common research practices carried out in good faith. Such practices include accidental or intentional p-hacking where researchers try variations of their analysis until they find significant results; a garden of forking paths where researcher decisions lead to a vast understatement of the number of true “researcher degrees of freedom” in their research designs; the file-drawer problem which leads only statistically significant results to be published; and underpowered studies, which make it so that only overstated effect sizes can be detected.
Graph of the relationship between statistical power and the rates of false discovery. [Taken from this answer on the statistics Q&A site Cross Validated.]
To the degree that much of CSCW and HCI use the same research methods and approaches as these other social scientific fields, there is every reason to believe that these issues extend to social computing research. Of course, given that replication is exceedingly rare in HCI, HCI researchers will rarely even find out that a result is wrong.
To date, no comprehensive set of solutions to these issues exists. However, scholarly communities can take steps to reduce the threat of false discovery. One set of approaches to doing so involves the introduction of changes to the way quantitative studies are planned, executed, and reviewed. We want to encourage the CSCW community to consider supporting some of these practices.
Among the approaches developed and adopted in other research communities, several involve breaking up research into two distinct stages: a first stage in which research designs are planned, articulated, and recorded; and a second stage in which results are computed following the procedures in the recorded design (documenting any changes). This stage-based process ensures that designs cannot shift in ways that shape findings without some clear acknowledgement that such a shift has occurred. When changes happen, adjustments can sometimes be made in the computation of statistical tests. Readers and reviewers of the work can also have greater awareness of the degree to which the statistical tests accurately reflect the analysis procedures or not and adjust their confidence in the findings accordingly.
Versions of these stage-based research designs were first developed in biomedical randomized controlled trials (RCTs) and are extremely widespread in that domain. For example, pre-registration of research designs is now mandatory for NIH funded RCTs and several journals are reviewing and accepting or rejecting studies based on pre-registered designs before results are known.
A proposal for CSCW
In order to address the challenges posed by false discovery, CSCW could adopt a variety of approaches from other fields that have already begun to do so. These approaches entail more or less radical shifts to the ways in which CSCW research gets done, reviewed, and published.
As a starting point, we want to initiate discussion around one specific proposal that could be suitable for a number of social computing studies and would require relatively little in the way of changes to the research and reviewing processes used in our community.
Drawing from a series of methodological pieces in the social sciences ([1], [2], [3]), we propose a method based on split-sample designs that would be entirely optional for CSCW authors at the time of submission.
Essentially, authors who chose to do so could submit papers which were written—and which will be reviewed and revised—based on one portion of their dataset with the understanding that the paper would be published using identical analytic methods also applied to a second, previously un-analyzed portion of the dataset. Authors submitting under this framework would choose to have their papers reviewed, revised and resubmitted, and accepted or rejected based on the quality of the research questions, framing, design, execution, and significance of the study overall. The decision would not be based on the statistical significance of final analysis results.
The idea follows from the statistical technique of “cross validation,” in which an analysis is developed on one subset of data (usually called the “training set”) and then replicated on at least one other subset (the “test set”).
To conduct a project using this basic approach, a researcher would:
Randomly partition their full dataset into two (or more) pieces.
Design, refine, and complete their analysis using only one piece identified as the training sample.
Undergo the CSCW review process using the results from this analysis of the training sample.
If the submission receives a decision of “Revise and Resubmit,” authors would then make changes to the analysis of the training sample as requested by ACs and reviewers in the current normal way.
If the paper is accepted for publication, the authors would then (and only then) run the final version of the analysis using another piece of their data identified as the test sample and publish those results in the paper.
We expect that authors would also publish the training set results used during review in the online supplement to their paper uploaded to the ACM Digital Library.
Like any other part part of a paper’s methodology, the split sample procedure would be documented in appropriate parts of the paper.
We are unaware of prior work in social computing that has applied this process. Researchers in data mining, machine learning, and related fields of computer science use cross-validation all the time, they do so differently in order to solve distinct problems (typically related to model overfitting).
The main benefits of this approach (discussed in much more depth in the references at the beginning of this section) would be:
Heightened reliability and reproducibility of the analysis.
Reduced risk that findings reflect spurious relationships, p-hacking, researcher or reviewer degrees of freedom, or other pitfalls of statistical inference common in the analysis of behavioral data—i.e., protection against false discovery.
A procedural guarantee that the results do not determine the publication (or not) of the work—i.e., protection against publication bias.
The most salient risk from the approach is that results might change when authors run the final analysis on the test set. In the absence of p-hacking and similar issues, such changes will usually be small and will mostly impact the magnitude of effects estimates and their associated standard errors. However, some changes might be more dramatic. Dealing with changes of this sort would be harder for authors and reviewers and would potentially involve something along the lines of the shepherding that some papers receive now.
Let’s talk it over!
This blog post is meant to spark a wider discussion. We hope this can happen during CSCW this year and beyond. We believe the procedure we have proposed would enhance the reliability of our work and is workable in CSCW because it involves narrow changes to the way that quantitative CSCW research and reviewing is usually conducted. We also believe this procedure would serve the long term interests of the HCI and social computing research community. CSCW is a leader in building better models of scientific publishing within HCI through the R&R process, eliminated page limits, the move to PACM, and more. We would like to extend this spirit to issues of reproducibility and publication bias. We are eager to discuss our proposal and welcome suggestions for changes.
Michael L Anderson and Jeremy Magruder. Split-sample strategies for avoiding false discoveries. Technical report, National Bureau of Economic Research, 2017. https://www.nber.org/papers/w23544
Susan Athey and Guido Imbens. Recursive partitioning for heterogeneous causal effects. Proceedings of the National Academy of Sciences, 113(27):7353–7360, 2016. https://doi.org/10.1073/pnas.1510489113
Marcel Fafchamps and Julien Labonne. Using split samples to improve inference on causal effects. Political Analysis, 25(4):465–482, 2017. https://doi.org/10.1017/pan.2017.22
Couchsurfing and Airbnb are websites that connect people with an extra guest room or couch with random strangers on the Internet who are looking for a place to stay. Although Couchsurfing predates Airbnb by about five years, the two sites are designed to help people do the same basic thing and they work in extremely similar ways. They differ, however, in one crucial respect. On Couchsurfing, the exchange of money in return for hosting is explicitly banned. In other words, couchsurfing only supports the social exchange of hospitality. On Airbnb, users must use money: the website is a market on which people can buy and sell hospitality.
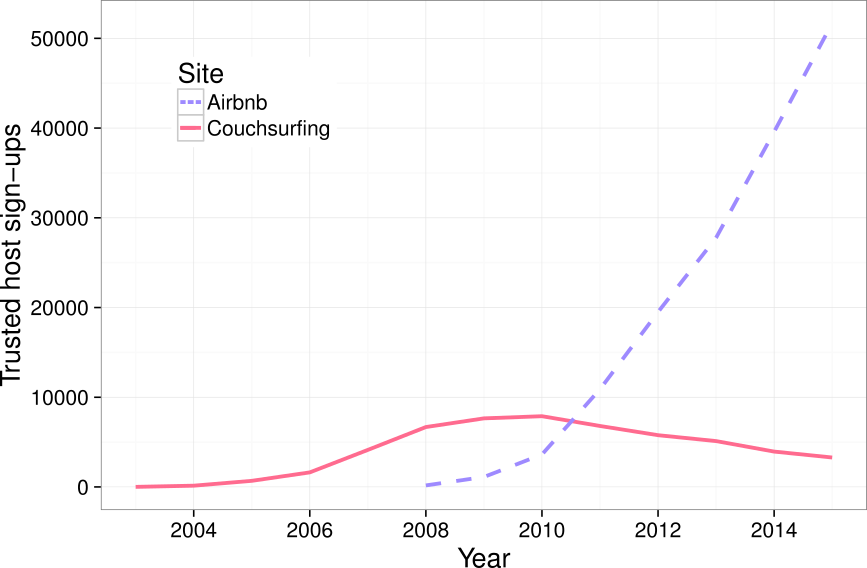
Comparison of yearly sign-ups of trusted hosts on Couchsurfing and Airbnb. Hosts are “trusted” when they have any form of references or verification in Couchsurfing and at least one review in Airbnb.
The figure above compares the number of people with at least some trust or verification on both Couchsurfing and Airbnb based on when each user signed up. The picture, as I have argued elsewhere, reflects a broader pattern that has occurred on the web over the last 15 years. Increasingly, social-based systems of production and exchange, many like Couchsurfing created during the first decade of the Internet boom, are being supplanted and eclipsed by similar market-based players like Airbnb.
In a paper led by Max Klein that was recently published and will be presented at the ACM Conference on Computer-supported Cooperative Work and Social Computing (CSCW) which will be held in Jersey City in early November 2018, we sought to provide a window into what this change means and what might be at stake. At the core of our research were a set of interviews we conducted with “dual-users” (i.e. users experienced on both Couchsurfing and Airbnb). Analyses of these interviews pointed to three major differences, which we explored quantitatively from public data on the two sites.
First, we found that users felt that hosting on Airbnb appears to require higher quality services than Couchsurfing. For example, we found that people who at some point only hosted on Couchsurfing often said that they did not host on Airbnb because they felt that their homes weren’t of sufficient quality. One participant explained that:
“I always wanted to host on Airbnb but I didn’t actually have a bedroom that I felt would be sufficient for guests who are paying for it.”
An another interviewee said:
“If I were to be paying for it, I’d expect a nice stay. This is why I never Airbnb-hosted before, because recently I couldn’t enable that [kind of hosting].”
We conducted a quantitative analysis of rates of Airbnb and Couchsurfing in different cities in the United States and found that median home prices are positively related to number of per capita Airbnb hosts and a negatively related to the number of Couchsurfing hosts. Our exploratory models predicted that for each $100,000 increase in median house price in a city, there will be about 43.4 more Airbnb hosts per 100,000 citizens, and 3.8 fewer hosts on Couchsurfing.
A second major theme we identified was that, while Couchsurfing emphasizes people, Airbnb places more emphasis on places. One of our participants explained:
“People who go on Airbnb, they are looking for a specific goal, a specific service, expecting the place is going to be clean […] the water isn’t leaking from the sink. I know people who do Couchsurfing even though they could definitely afford to use Airbnb every time they travel, because they want that human experience.”
In a follow-up quantitative analysis we conducted of the profile text from hosts on the two websites with a commonly-used system for text analysis called LIWC, we found that, compared to Couchsurfing, a lower proportion of words in Airbnb profiles were classified as being about people while a larger proportion of words were classified as being about places.
Finally, our research suggested that although hosts are the powerful parties in exchange on Couchsurfing, social power shifts from hosts to guests on Airbnb. Reflecting a much broader theme in our interviews, one of our participants expressed this concisely, saying:
“On Airbnb the host is trying to attract the guest, whereas on Couchsurfing, it works the other way round. It’s the guest that has to make an effort for the host to accept them.”
Previous research on Airbnb has shown that guests tend to give their hosts lower ratings than vice versa. Sociologists have suggested that this asymmetry in ratings will tend to reflect the direction of underlying social power balances.
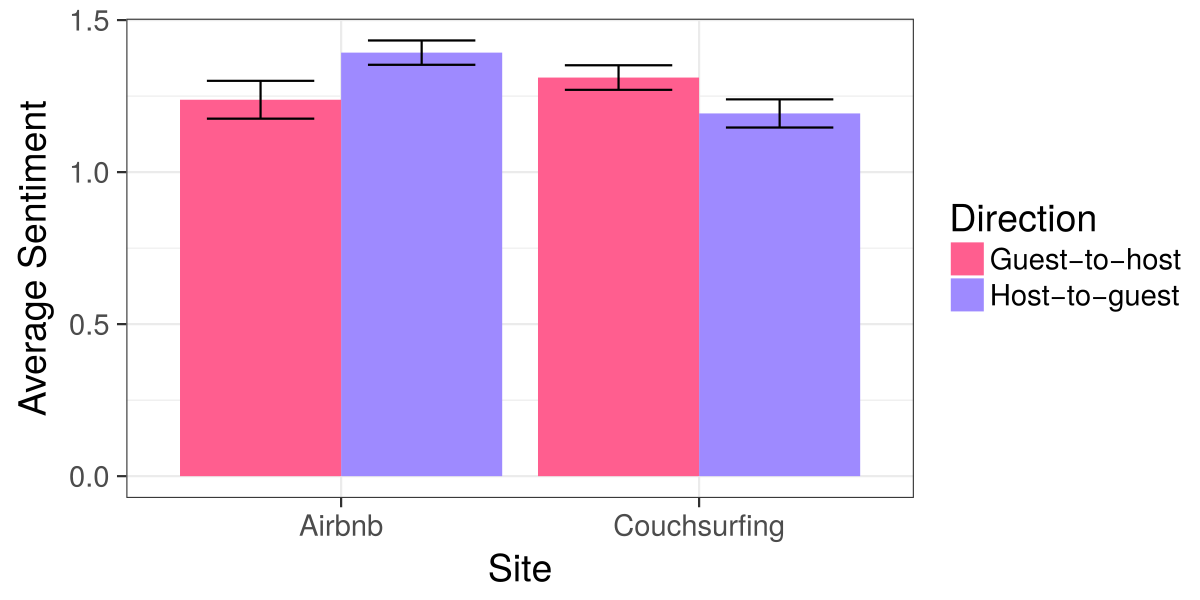
Average sentiment score of reviews in Airbnb and Couchsurfing, separated by direction (guest-to-host, or host-to-guest). Error bars show the 95% confidence interval.
We both replicated this finding from previous work and found that, as suggested in our interviews, the relationship is reversed on Couchsurfing. As shown in the figure above, we found Airbnb guests will typically give a less positive review to their host than vice-versa while in Couchsurfing guests will typically a more positive review to the host.
As Internet-based hospitality shifts from social systems to the market, we hope that our paper can point to some of what is changing and some of what is lost. For example, our first result suggests that less wealthy participants may be cut out by market-based platforms. Our second theme suggests a shift toward less human-focused modes of interaction brought on by increased “marketization.” We see the third theme as providing somewhat of a silver-lining in that shifting power toward guests was seen by some of our participants as a positive change in terms of safety and trust in that guests. Travelers in unfamiliar places often are often vulnerable and shifting power toward guests can be helpful.
Although our study is only of Couchsurfing and Airbnb, we believe that the shift away from social exchange and toward markets has broad implications across the sharing economy. We end our paper by speculating a little about the generalizability of our results. I have recently spoken at much more length about the underlying dynamics driving the shift we describe in my recent LibrePlanet keynote address.
More details are available in our paper which we have made available as a preprint on our website. The final version is behind a paywall in the ACM digital library.
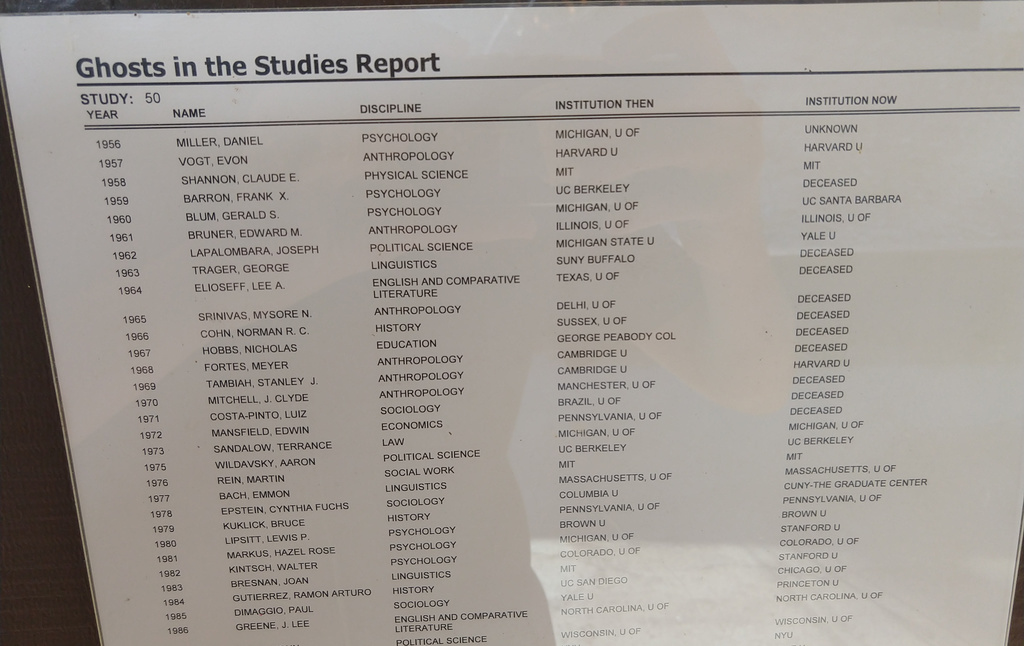
Every CASBS study is labeled with a list of “ghosts” who previously occupied the study. This year, I’m spending the year in Study 50 where I’m haunted by an incredible cast that includes many people whose scholarship has influenced and inspired me.
The top part of the list of ghosts in Study #50 at CASBS.
Foremost among this group is Study 50’s third occupant: Claude Shannon.¹
At 21 years old, Shannon’s masters thesis (sometimes cited as the most important masters thesis in history) proved that electrical circuits could encode any relationship expressible in Boolean logic and opened the door to digital computing. Incredibly, this is almost never cited as Shannon’s most important contribution. That came in 1948 when he published a paper titled A Mathematical Theory of Communication which effectively created the field of information theory. Less than a decade after its publication, Aleksandr Khinchin (the mathematician behind my favorite mathematical constant) described the paper saying:
Rarely does it happen in mathematics that a new discipline achieves the character of a mature and developed scientific theory in the first investigation devoted to it…So it was with information theory after the work of Shannon.
As someone whose own research is seeking to advance computation and mathematical study of communication, I find it incredibly propitious to be sharing a study with Shannon.
Although I teach in a communication department, I know Shannon from my background in computing. I’ve always found it curious that, despite the fact Shannon’s 1948 paper is almost certainly the most important single thing ever published with the word “communication” in its title, Shannon is rarely taught in communication curricula is sometimes completely unknown to communication scholars.
In this regard, I’ve thought a lot about this passage in Robert’s Craig’s influential article “Communication Theory as a Field” which argued:
In establishing itself under the banner of communication, the discipline staked an academic claim to the entire field of communication theory and research—a very big claim indeed, since communication had already been widely studied and theorized. Peters writes that communication research became “an intellectual Taiwan-claiming to be all of China when, in fact, it was isolated on a small island” (p. 545). Perhaps the most egregious case involved Shannon’s mathematical theory of information (Shannon & Weaver, 1948), which communication scholars touted as evidence of their field’s potential scientific status even though they had nothing whatever to do with creating it, often poorly understood it, and seldom found any real use for it in their research.
In preparation for moving into Study 50, I read a new biography of Shannon by Jimmy Soni and Rob Goodman and was excited to find that Craig—although accurately describing many communication scholars’ lack of familiarity—almost certainly understated the importance of Shannon to communication scholarship.
For example, the book form of Shannon’s 1948 article was published by University Illinois on the urging of and editorial supervision of Wilbur Schramm (one of the founders of modern mass communication scholarship) who was a major proponent of Shannon’s work. Everett Rogers (another giant in communication) devotes a chapter of his “History of Communication Studies”² to Shannon and to tracing his impact in communication. Both Schramm and Rogers built on Shannon in parts of their own work. Shannon has had an enormous impact, it turns out, in several subareas of communication research (e.g., attempts to model communication processes).
Although I find these connections exciting. My own research—like most of the rest of communication—is far from the substance of technical communication processes at the center of Shannon’s own work. In this sense, it can be a challenge to explain to my colleagues in communication—and to my fellow CASBS fellows—why I’m so excited to be sharing a space with Shannon this year.
Upon reflection, I think it boils down to two reasons:
Shannon’s work is both mathematically beautiful and incredibly useful. His seminal 1948 article points to concrete ways that his theory can be useful in communication engineering including in compression, error correcting codes, and cryptography. Shannon’s focus on research that pushes forward the most basic type of basic research while remaining dedicated to developing solutions to real problems is a rare trait that I want to feature in my own scholarship.
Shannon was incredibly playful. Shannon played games, juggled constantly, and was always seeking to teach others to do so. He tinkered, rode unicycles, built a flame-throwing trumpet, and so on. With Marvin Minsky, he invented the “ultimate machine”—a machine that’s only function is to turn itself off—which he kept on his desk. A version of the Shannon’s “ultimate machine” that is sitting on my desk at CASBS.
I have no misapprehension that I will accomplish anything like Shannon’s greatest intellectual achievements during my year at CASBS. I do hope to be inspired by Shannon’s creativity, focus on impact, and playfulness. In my own little ways, I hope to build something at CASBS that will advance mathematical and computational theory in communication in ways that Shannon might have appreciated.
Incredibly, the year that Shannon was in Study 50, his neighbor in Study 51 was Milton Friedman. Two thoughts: (i) Can you imagine?! (ii) I definitely chose the right study!
Rogers book was written, I found out, during his own stint at CASBS. Alas, it was not written in Study 50.
Forming: Group members get to know each other and define their task.
Storming: Through argument and disagreement, power dynamics emerge and are negotiated.
Norming: After conflict, groups seek to avoid conflict and focus on cooperation and setting norms for acceptable behavior.
Performing: There is both cooperation and productive dissent as the team performs the task at a high level.
Fortunately for organizational science, 1965 was hardly the last stage of development for Tuckman’s theory!
Twelve years later, Tuckman suggested that adjourning or mourning reflected potential fifth stages (Tuckman and Jensen 1977). Since then, other organizational researchers have suggested other stages including transforming and reforming (White 2009), re-norming (Biggs), and outperforming (Rickards and Moger 2002).
What does the future hold for this line of research?
The good news is that despite the active stream of research producing new stages that end or rhyme with -orming, there are tons of great words left!
For example, stages in a group’s development might include:
Scorning: In this stage, group members begin mocking each other!
Misinforming: Groups that reach this stage start producing fake news.
Shoehorning: These groups try to make their products fit into ridiculous constraints.
Chloroforming: Groups become languid and fatigued?
One benefit of keeping our list in the wiki is that the organizational research community can use it to coordinate! If you are planning to use one of these terms—or if you know of a paper that has—feel free to edit the page in our wiki to “claim” it!